





This article has been translated from English to Gen Z Slang.
The Stochastic Oscillator be like a vibe check for the stock game, showing the current closing price's spot in the high-low range over a set number of periods. 😉
My dude George C. Lane came up with this in the late 1950s. Homeboy was all about momentum changing before price, so he invented the Stochastic Oscillator to ride the “speed” or momentum of price. 🚀
This oscillator rolls with the idea that in an uptrend, prices stay lit at or above the last period’s close. In a downtrend, they chill at or below the last close. 📉
Breaking it down in Gen Z terms:
- In an uptrend, the closing price is like, “Let’s hang out near the high.”🌟
- In a downtrend, the closing price is more like, “I’m chilling near the low.”
If the closing price decides to distance itself from the high or low, it’s a sign that momentum is hitting the brakes. 🛑
Stochastics are low-key MVPs in broad trading ranges or trends that take their sweet time to move. 😎
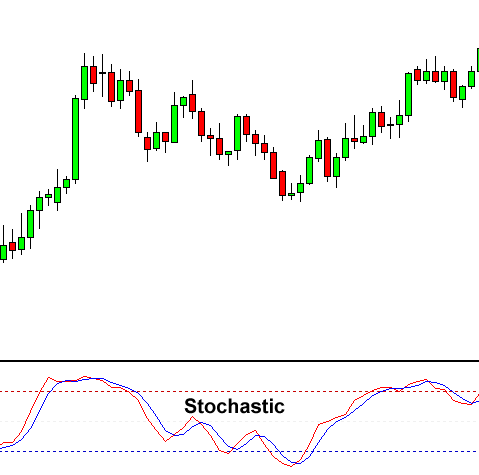
How Stochastic Climbs the Charts 🌈
This indicator vibes from 0 to 100. 💯
There's two main players: %K, which is like the fast-paced TikTok dance, and %D, the chill moving average of %K. 😜
Think of the Stochastic Oscillator as checking how close the close is within the high-low range over time.
Assume Max High is 100, Min Low is 90, and Close is 98.
This means the high-low range is 10 (100-90), which is your division game, or denominator, in the %K stats. 🧠
The close less the lowest low equals 8, which becomes the numerator.
8 divided by 10 equals .80 or 80%.
Multiply by 100 to get that sweet %K.
%K at 20 would be if the close was at 92 (.20 x 100).
If Stochastic Oscillator's flexing above 50, close is vibing in the top range. Under 50, it’s chilling in the bottom range.
Low readings (under 20) spill the tea that price is super close to its LOW for the time. 📉
High readings (above 80) say price is peeping at its HIGH for the time. 📈
Trading with Stochastic 🔥
Levels of Overbought/Oversold 🌊
The 80 and 20 levels are the real MVPs here. Above 80 = overbought flex zone, below 20 = oversold drama. 😅
- Time to sell when the oscillator is above 80, then crosses below 80. 💔
- Time to buy when the oscillator is below 20, then rebounds above 20. 💪
Crossover Signal Vibes 💫
Crossover signal when the dynamic duo crosses paths in the overbought or oversold territories.
- Sell signal when %K dives under %D in overbought land.
- Buy signal when %K skyrockets over %D in oversold land.
Peekin’ Divergences 🔍
Divergences pop up when the price is out here making high or low moves, but the Stochastic Oscillator is saying, “Nah fam.”
- Bullish divergence rolls in when price hits a lower low, but Stochastic's like, "Nah, making a higher low," hinting at possible bullish comeback. 🚀
- Bearish divergence shows up when price hits a higher high, but Stochastic’s forming lower high, signaling less upward heat and possible bearish turn. ⬇️
There are three flavors of the Stochastic Oscillator: Fast, Slow, and Full.
Each has its own twist on calculating the basic Stochastic Oscillator’s number. ✨