





This article has been translated from English to Gen Z Slang.
The Commodity Channel Index (CCI) is like that one TikTok trend where you measure if you're vibing or not based on price levels compared to their average over time. 😎
This cool tool was cooked up by Donald Lambert for spotting those glow-up moments in commodities. 🌈
So, it's basically a mood ring for prices, which means it's used to catch those "whoa, chill out" or "go harder" vibes, aka overbought and oversold levels. 💹
The basic tea on CCI: it thinks things play on repeat, so the highs and lows happen on the regular. ⏰
The CCI lets you know when a big mood change is about to drop. 📉😲📈
OG Lambert was out there using CCI for commodities, but nowadays it's the versatile baddie of technical indicators. 🤑💫
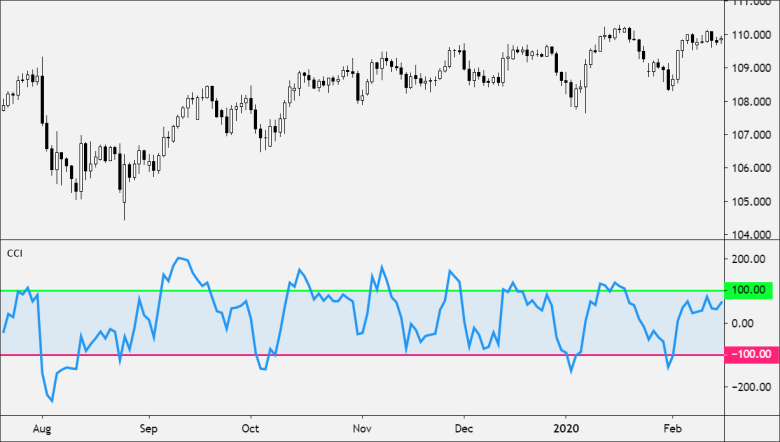
How the Commodity Channel Index (CCI) Slays
The CCI just wants to see how prices are currently vibing compared to the average: zero is the base line, fam! 🕺
The CCI goes wild above and below zero.
- CCI's on fire when prices are way above average. 🔥
- CCI's dragging when prices are way below average. 😴
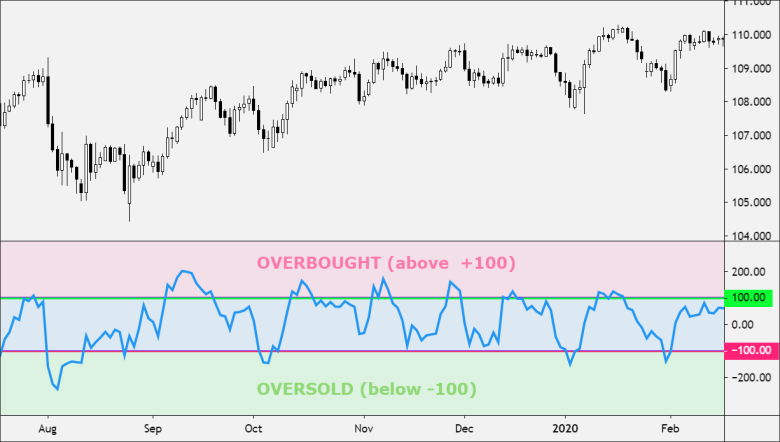
Using this, CCI is your hype squad for picking out overbought and oversold moods. 🕶️
The percentage keeping it chill between +100 and -100 depends on how many periods you're checking.
- A quicker CCI is like espresso — more jumpy, with less chill most of the time. ☕
- The more vibes you measure, the more likely you'll stay between +100 and -100. 📏
Lambert’s rules for CCI are all about when it pops above +100 and below -100 to tell you when to YOLO in or hands-off. 🚀✋
Because like, 70-80% of the CCI feels just lurk between +100 and -100, a buy or sell tea will only spill about 20 to 30% of the time. ☕😲
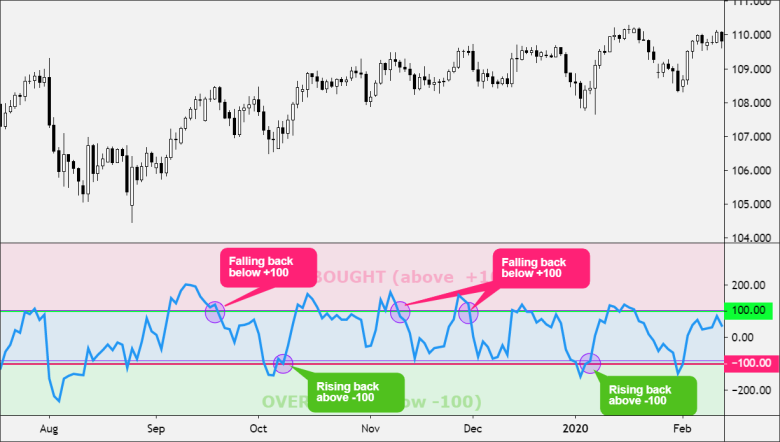
Buy Signal
- When the CCI glow-ups above +100, it's time to flex with a buy signal. 📈💲
- Close the position when the CCI drops back below +100 — like, regroup fam. 😅
Sell Signal
- When the CCI dives below -100, it's time for a savage sell. 📉🏃♂️
- Shut down that position when the CCI climbs back above -100, 'cause the dip's done. 🙅♀️
How to Use the CCI Like a Pro
The CCI is a jack-of-all-trades, fam, and you can serve it in diff ways. 🍜✨
Overbought and Oversold Levels
CCI's your tool for picking overbought and oversold levels. 🔍
- An asset's considered oversold when the CCI tanks below -100. 😩
- From down low, a buy signal might drop in when CCI pops above -100. 📈
- An asset's overbought when the CCI rockets above +100. 🚀
- After an overbought peak, scoop a sell signal if CCI drops back below +100. 📉
CCI Divergence
Like most mood checks, make a move when what you're seeing clashes with what's happening. 📊✨
- A positive divergence below -100 adds extra fire to signals moving above -100. 🔥
- A negative divergence above +100 dumps more chill on signals moving below +100. ❄️
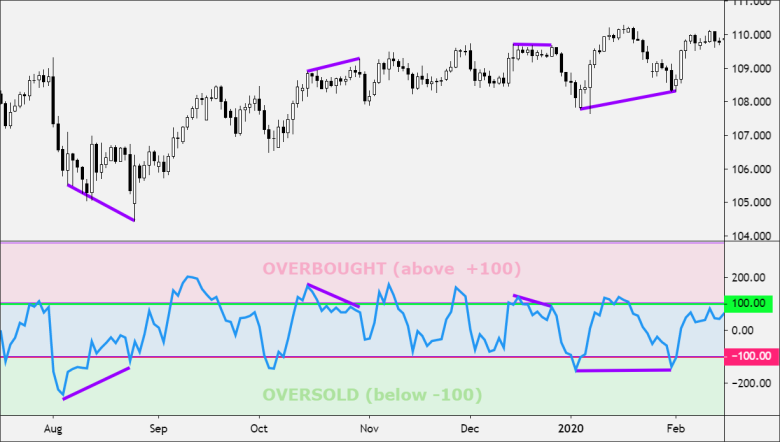
CCI Trend Line Breaks
Using trendline breaks? That's how the real ones make a move. Draw those lines connecting peaks and drops. 🎨💸
- From lows, a spike above -100 with a trend line breakout says, "Let's go bullish." 🐂🎉
- From highs, a dip below +100 with a trend line break says, "It's bearish time." 🐻🔻
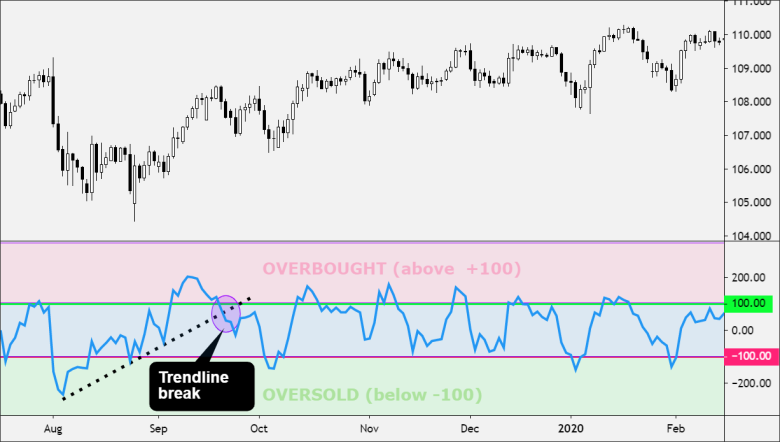
Traders got the CCI as their guide to spot price flips, intense vibes, and the strength of the trend. 💪🚥
For best results, team up the CCI with other technical squad members. 🤜🤛
How to Do the CCI Math (Like a Genius)
Get ready to show off your calculator skills, 'cause the CCI takes a few steps. ✍️
Here's what you gotta do, step by step: 🕺
First, find the typical price — high, low, and close are your squad here, just average them out. 📊
The formula is:
TP = (High + Low + Close) / 3
- TP is your typical price.
- High is that peak price mood.
- Low is the bottom dollar.
- Close marks the last call for prices.
Then, compute the moving average of the typical price across the specified time frame. 🗓️
TPAVG = (TP1 + TP2 +... + TPn) / n
- TPAVG is the rolling vibe of your typical price.
- TP is the flavor of the typical price for each period.
- n is how many vibes you're counting. 📜
This next step is a head scratcher; you're diving into mean deviation math. 🧠
MD = (|TP1 - TPAVG1| +... + | TPn - TPAVGn |) / n
- MD is all about that average deviation for each cycle.
- TPn is the typical price in that one special moment.
- TPAVGn is the moving mood of typical price for that period.
- n is still the count of periods.
Absolute values are the key here, no negative vibe allowed. 💀
This is the final boss move, the CCI formula:
CCI = (TPt - TPAVGt) / (.015 * MDT)
- CCI is the main character.
- TPt is today's typical price.
- TPAVGt is the rolling average vibe.
- .015 is the magic number keeping it all together.
- MDT is the average space between prices today.
Lil' shoutout to Lambert for setting .015 as the constant to keep most CCI values living between -100 and +100. Genius move. 💡