





This article has been translated from English to Gen Z Slang.
A Weighted Moving Average (WMA) is like that fave hoodie that keeps you cozy—puttin' emphasis on the recent vibes and ignoring old school data like yesterday's memes. 🤘
A moving average is kinda like sliding into your DMs—it shows how prices ghost or post, basically the rundown of the scene over a certain timeline.
Thanks to its low-key sneaky math, WMA stays right on the heels of prices like your clingiest follower, unlike the more basic Simple Moving Average (SMA).
WMA also gives top priority to recent info more than the Exponential Moving Average (EMA), weighting values like it’s choosing celebs at the Met Gala—newer data rules the red carpet. 🌟

This means that the oldest rate in the mix gets a low rating, like the first to get eliminated on a reality show. Ratings climb as you get closer to the freshest gossip. 📈
Just so you know, if on:
- Day 1, the price = 100
- Day 2 = 102
- Day 3 = 105
- Day 4 = 104
- And now, Day 5 = 110
The numerical vibe check would be 1+2+3+4+5 = 15
And that 5-Day WMA math would flex to: 100*(1/15) + 102*(2/15) + 105*(3/15) + 104*(4/15) + 110*(5/15) = 105.7 💥
Some traders swear this method is more clutch for spotting trends, particularly in a market that's hoppin' like a popular TikTok dance. 📊
But keep it 100—a downside is WMA can be "choppier" than a Simple Moving Average (SMA), kinda like trying to spot a real trend through a pile of fake filters—it might trigger a false sense of "buy or sell." 😅
That's why some folks jam both a Simple Moving Average (SMA) and a Weighted Moving Average (WMA) onto the same chart, like layering outfits for maximum drip. 🧥

How to Serve Up Weighted Moving Average (WMA) Vibes
Every moving average, WMA included, isn't here for popping trades at the precise top or bottom, like dodging cringy ads on Snapchat. 📉
Moving averages are like the real ones who confirm your trade vibe is trending in the general direction but tends to lag on the fashionably late side at entry and exit. 🕒
Here’s the tea on using WMA in your trades:
The WMA flexes by peeping trend directions. 🔍
- If prices are trending up and surfing above a rising WMA, go long while prices dip just below the WMA—catching waves like it’s summer. 🌊
- If prices are dropping and slumping below a falling WMA, go short when prices bounce toward or slightly above the WMA. 🎢
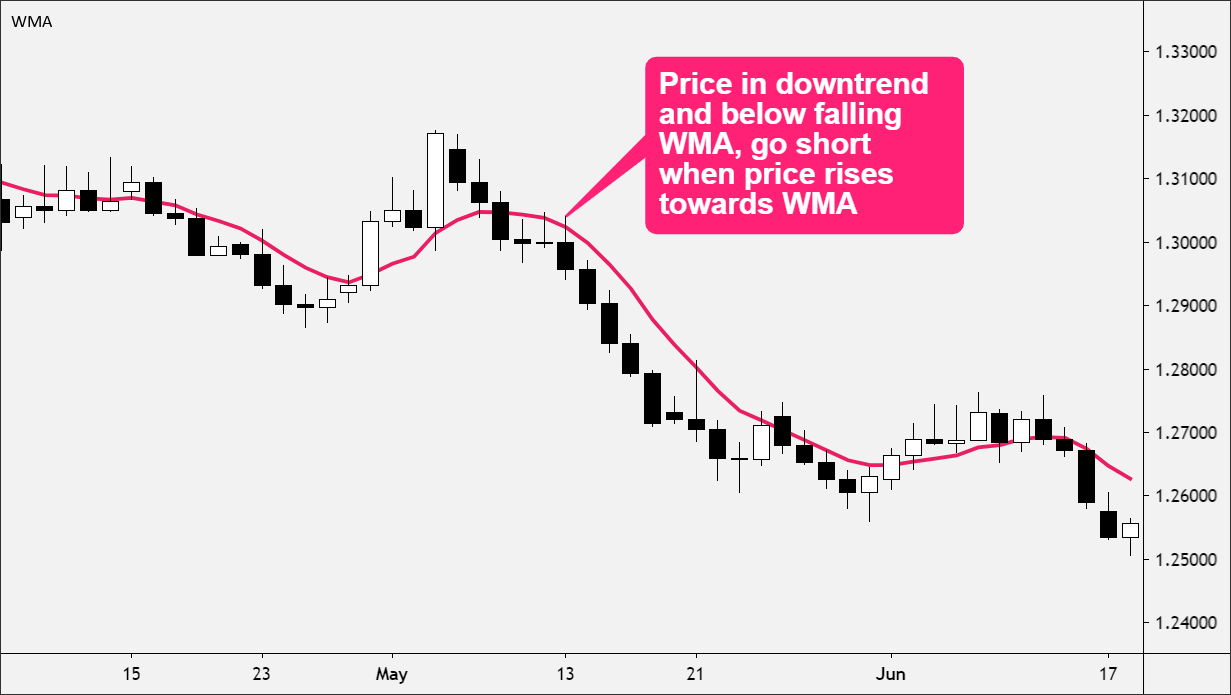
The WMA can take up a role in support and resistance zones.
- A rising WMA is like a hype squad, backing up the action. 📈
- A falling WMA acts like a hater, stopping the action cold. 📉
This strategy backs the idea of buyin' when the price nears the come-up of the rising WMA or selling close to the downfall of a falling WMA.

Weighted Moving Average (WMA) vs. Simple Moving Average (SMA) Face-Off 😎
When deploying WMA, it's the same playbook as with the SMA.
Given WMA's speed game, it's more in tune with price shifts than your bestie's FOMO on the latest trend.
This trait is both lit and sus. 🔥
It’s lit because the WMA throws shade on trends faster than an SMA.
It’s sus because WMA might throw you into whiplash whirlies more often than an SMA. 🤨
Breaking Down the Weighted Moving Average (WMA) Math
The WMA makes recent prices VIPs, unlike those old-school plays that hit the nostalgia bin. 🕹️
Each period's digits are multiplied by their weight, like tiered social media influencers, with the weight decided by the selected periods.
For real, a 5-period WMA falls like so:
WMA = (P1 * 5) + (P2 * 4) + (P3 * 3) + (P4 * 2) + (P5 * 1) / (5 + 4+ 3 + 2 + 1)
Where:
P1 = current price
P2 = price one bar ago, and so forth…
You can level up the weighted moving average more than the low-key SA and EMA. 🎮
Generally, the freshest price points get the king and queen levels, but you can switch it up and flip style to rate the nostalgia gems higher if you’re feelin' retro. 🕶