





This article has been translated from English to Gen Z Slang.
A Simple Moving Average (SMA) is like the GOAT of technical indicators, showing off what's poppin' with an asset's average price over a specific period. 📈✨
It's basically a mash-up of prices summed up and divided by the number of vibes—or data points—being collected. 💯
Like, if you got recent prices of 1, 2, 3, your average is basically the mood ring of 1+2+3, split by 3 reporting periods. EZ-PZ right? 😎
Total those prices up to 6 and when you divide by the 3 periods, you get 2. That's the tea! ☕️🤓
Why's it called a moving average? It's causin' a scene on the chart with each bar, like it moves as the average price vibes change. Movement goals, am I right? 💃📉
Each time fresh price drops, the average slides along, always living its best life based on the latest same number of reporting periods. 🔄
Bring in the SMA to cut through that market noise like a pair of noise-canceling AirPods, so you can peep the overall trend direction. 🧘♂️
How to Use the Simple Moving Average (SMA)
SMAs vibe with smoothing price data.
The longer the SMA period, the smoother the results. But that lag gets intense the longer it goes, kinda like the delay in a glitchy TikTok. ⏳📱
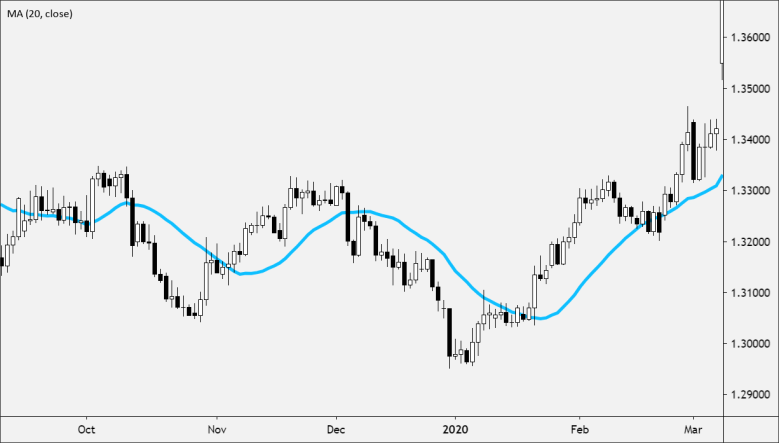
SMAs are your BFFs for identifying trend direction.
- If the SMA is cruising up, you gotta trend upwards, fam. 🚀🏄♀️
- If the SMA is hitting a downward spiral, say hello to a downtrend. 😞
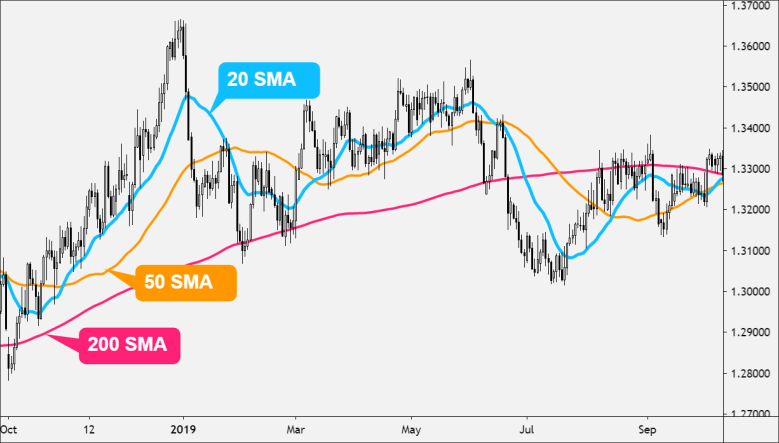
- A 200-period SMA is the wise old sage for spotting long-term trends. 👴
- A 50-period SMA gives you those vibes of middle-ground trends.
- 5, 10, or 20-period SMAs are the short-term TMI, getting you the temp-read on smaller trends. 🔍
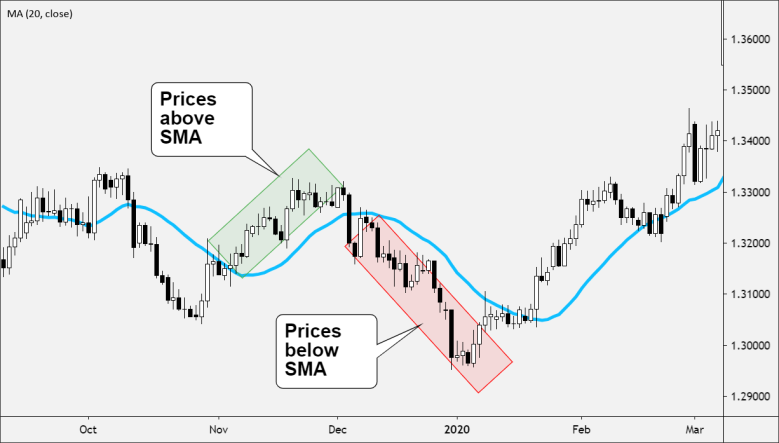
When price is pullin' off a crossover stiletto above/below an SMA…
- If price heads up and over the SMA, you got yourself a glow-up moment known as bullish. 🐂✨
- If price takes a nosedive below the SMA, it's all about that bearish energy. 🐻💔
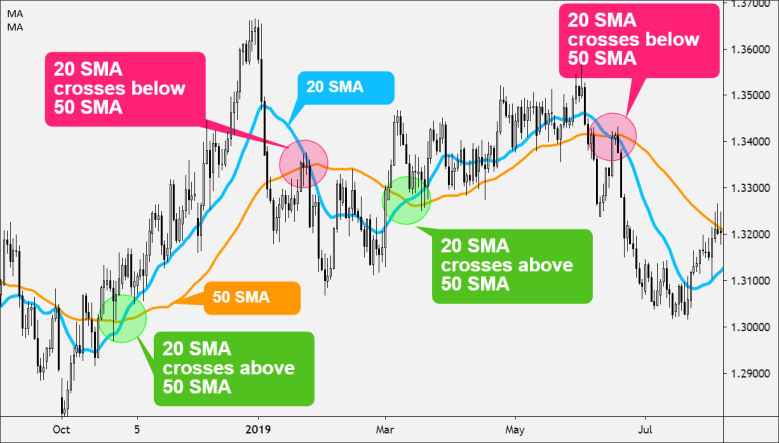
When an SMA goes full renegade above/below another SMA…
- Slap two SMAs on the same chart for that double trouble view.
- You'll always see a cute 'faster' moving average, full of energy, paired up with that ‘slow and steady’ moving average.
- If the speedy average levels up above the chill average, think of it as a buy signal creepin' in. 🛒💸
- If the quickster drops lower than the chill average, time to consider selling. 🚨
How to Calculate Simple Moving Average (SMA)
No need to trip like we're doing rocket science or anything. SMA is just the average, summa those price values spread out over a certain lit timeframe. 😅
SMA = (A1 + A2 + ……….An) / n
Where:
A = average in period n
n n is the number of periods