


The Fed’s June meeting delivered one of the biggest hawkish surprises of the year: a unanimous hold paired with a dot plot that shifted the median 2026 rate forecast from a cut to a potential hike, with nine of eighteen officials now penciling in at least one quarter-point increase.
Against a backdrop of cautiously risk-friendly sentiment tied to progress in U.S.-Iran peace talks, new Fed Chair Kevin Warsh’s first press conference and a sharply higher inflation outlook sent the dollar broadly higher.
Watchlists are price outlook & strategy discussions supported by both fundamental & technical analysis, a crucial step towards creating a high-quality discretionary trade idea before working on a risk & trade management plan.
If you’d like to follow our “Watchlist” picks right when they are published throughout the week, check out our BabyPips Premium subscribe page to learn more!
The Setup
What We Were Watching: U.S. FOMC Statement (June 2026)
- Expectation: FOMC to hold at 3.50%–3.75%; market focus on Warsh’s inaugural tone and any shift in the dot plot
- Market environment surrounding the event: Broad risk sentiment was cautiously risk-friendly heading into the decision, as markets continued to price in the U.S.-Iran interim peace framework and the pending formal MOU signing scheduled for Friday in Switzerland. Equities had recovered from earlier-week geopolitical lows, crude oil was extending its wartime-premium unwind, and safe-haven demand for the dollar was already fading before the hawkish dot plot reversed that dynamic.
Event Outcome
The FOMC voted unanimously 12-0 to hold the federal funds rate at 3.50% to 3.75% on June 17, a result markets had fully priced in.
The real market mover was the updated Summary of Economic Projections, where nine of eighteen officials penciled in at least one quarter-point hike before year-end, six saw two or more, and the median 2026 dot shifted to roughly 3.8% from 3.4% in March, effectively flipping the implied next move from a cut to a potential hike.
Warsh skipped submitting his own year end rate forecast, tightened the policy statement to about 130 words, and used his first press conference to reinforce the hawkish message, while updated forecasts showed PCE inflation jumping to 3.6% from 2.7%, core PCE rising to 3.3% from 2.7%, GDP growth easing to 2.2% from 2.4%, and unemployment ticking down to 4.3% from 4.4%.
Key Takeaways:
- The FOMC held rates at 3.75% in a unanimous decision.
- The real catalyst was the hawkish dot plot. Nine Fed officials now pencil in a 2026 rate hike.
- PCE inflation was revised sharply higher to 3.6%, reinforcing the higher for longer message.
- Warsh’s debut press conference added another layer of uncertainty. His planned communications overhaul could mean fewer scheduled Fed pressers. That shift may change how traders read future Fed signals, especially when the statement and dots do more of the talking.
- The FOMC’s hawkish hold — a rate pause paired with a decisive upward revision to inflation projections and a dot plot now leaning toward tightening — was net bullish for USD.
- The dollar responded with a two-stage spike, first on the written statement and then reinforced by Warsh’s presser, closing the session up roughly 0.91% on the DXY near 100.4.
Fundamental Bias Triggered: Bullish USD
Promotion: Top-tier catalysts like the FOMC statement data can trigger emotional execution.
TradeZella AI powered journal turns your raw data into a high-performance playbook. Sync your broker, replay your trades bar-by-bar, and use the Playbook Designer to ensure that next time an economic data point surprises the market, you’re executing with clinical precision.
Click on the link to learn more and use code “PIPS20” to save 20% off first purchase!
Disclosure: We may earn a commission from our partners if you sign up through our links, at no extra cost to you.
Broad Market and Exogenous Drivers:
U.S.-Iran Peace Framework Drives Risk-On Reset (Monday–Tuesday)
The week opened on a strongly risk-on note as the United States and Iran announced an interim peace framework, with a formal MOU signing set for Friday in Switzerland. WTI crude fell roughly 3.5% to around $80 per barrel on supply-risk unwinding, the S&P 500 climbed about 1.6%, and the dollar shed safe-haven demand broadly.
The tone held into Tuesday despite the Bank of Japan delivering an already fully-priced hike and the Reserve Bank of Australia holding at 4.35%, with both decisions generating little fresh market direction. Crude extended its slide by another 4.6% toward $76 as Iranian tankers began moving through the now-unblocked Strait of Hormuz, and the dollar remained broadly soft through the session.
Hawkish FOMC Hold Resets Rate Expectations (Wednesday)
Wednesday centered entirely on the Fed. A U.K. CPI miss at 2.8% year-over-year early in the London session trimmed near-term BoE hike urgency and applied early pressure on Sterling. U.S. retail sales beat expectations at +0.9% month-over-month against a +0.6% forecast, providing the dollar modest pre-Fed support.
The hold at 3.50%–3.75% was expected, but the more hawkish dot plot was not. Nine of eighteen officials now pencil in at least one 2026 hike, with the PCE inflation forecast revised sharply to 3.6% from 2.7%. Warsh’s debut presser reinforced the hawkish message and signaled a communications overhaul. The dollar spiked twice, once on the written statement and again during the press conference, closing up roughly 0.91% on the DXY near 100.4. The S&P 500 fell approximately 1.37%, the 10-year Treasury yield rose to around 4.5%, and gold slid more than 2%.
Iran MOU Signed, But Pressure Remained (Thursday-Friday)
The formal US-Iran MOU signing eased geopolitical risk and lifted equities roughly 0.81%, but post-FOMC dollar strength held firm through two additional central bank catalysts. The SNB held at 0.00% as expected but added “if necessary” language to its intervention guidance; Chairman Schlegel’s silence on the wording change was read as dovish, sending CHF sharply lower. The BOE held at 3.75% in a 7-2 split vote, as dissenters Chief Economist Huw Pill and external member Megan Greene pushed for an immediate hike, but sterling found no relief.
Just when things were looking rosier on the geopolitical front, further US-Iran peace talks were put in jeopardy when Iran delayed further negotiations as the conflict in Lebanon worsened, and VP Vance canceled his trip to Switzerland. Later in Friday’s U.S. afternoon session, a confirmed Israel-Hezbollah ceasefire eased the uncertainty heading up to the weekend.
Scenario Scorecard: How Did They Play Out?
USD/CHF: Bullish USD Event Outcome + Risk-On Scenario = Arguably good odds of a net positive outcome
USD/CHF 1-hour Forex Chart Faster with TradingView
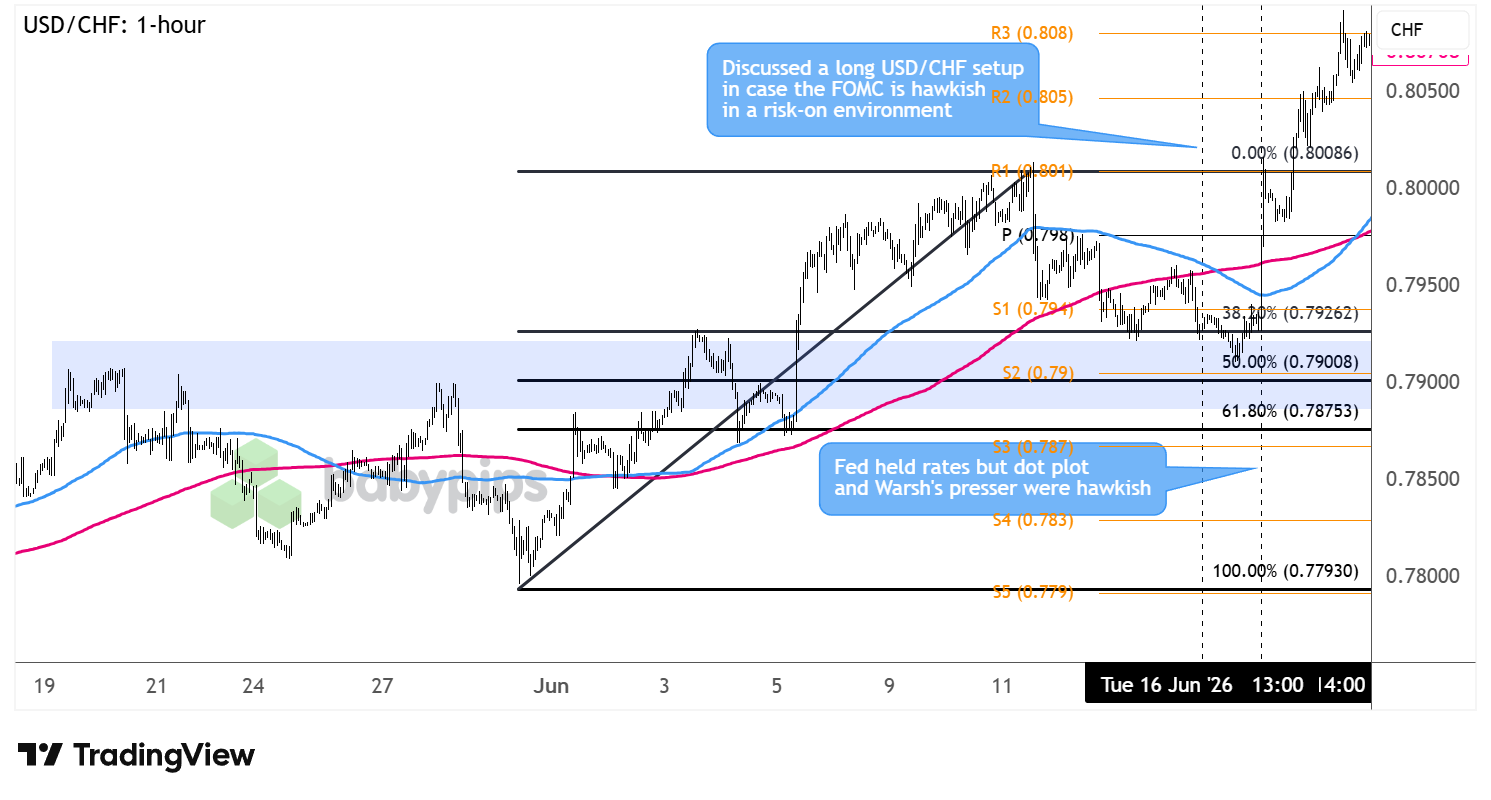
Because the FOMC delivered the hawkish surprise and because the ongoing unwind of U.S.-Iran geopolitical risk was already reducing safe-haven demand for the franc, this USD/CHF discussion was arguably the best-positioned setup to move beyond the watchlist stage.
Both conditions aligned clearly: the Fed’s hawkish dot plot and Warsh’s presser firmed the dollar, while the Iran peace framework advancing toward a formal signing and Thursday’s SNB dovish hold together kept CHF on the back foot, preventing any safe-haven counter-bid from capping the rally.
USD/CHF was sitting near the 38.2% Fib / S1 support zone around 0.7920 when the FOMC announcement landed, which was the precise area the watchlist had identified as the setup level for a dollar-bullish scenario.
The pair surged through R1 (0.8006) by Wednesday’s close, then extended above R2 (0.8048) on Thursday as the SNB’s “if necessary” language sent CHF broadly lower. By Friday morning, USD/CHF was trading near 0.8063, roughly 140+ pips above the pre-FOMC entry zone, with the price action clean and sustained across two full sessions.
Those who entered near the 38.2% Fib / S1 zone at or immediately after the FOMC statement had the most direct path to a positive outcome since the watchlist’s 0.8020 previous-highs target was reached cleanly within the session.
Traders who entered into the initial post-statement spike, between 0.7960 and 0.8000, faced brief chop during Warsh’s press conference before the second leg took hold, but the subsequent SNB-amplified continuation delivered directional follow-through for patient holders. For those who waited until Thursday’s SNB dovish confirmation as a secondary trigger, the entry point was above R1, but the continued push toward 0.8080 remained accessible.
Promoted: Capitalize on the News Events Without Risking Your Own Funds.
In a major inflation report release, the corresponding currency can swing wildly intraday. Why risk your personal capital during extreme volatility?
Most proprietary firms terminate your evaluation account if you execute a trade during a major macroeconomic release, but FundedNext permits news trading across all models. Test your thesis with up to $300,000 in simulated capital, or take advantage of their Free Trial to experience the platform risk-free.
Explore FundedNext and Start Your Free Trial!
Disclosure: We may earn a commission from our partners if you sign up through our links.
Not Eligible to Move Beyond Watchlist – GBP/USD & Bearish USD Setups
GBP/USD: Bullish USD Event Outcome + Risk-Off Scenario
GBP/USD 1-hour Forex Chart Faster with TradingView
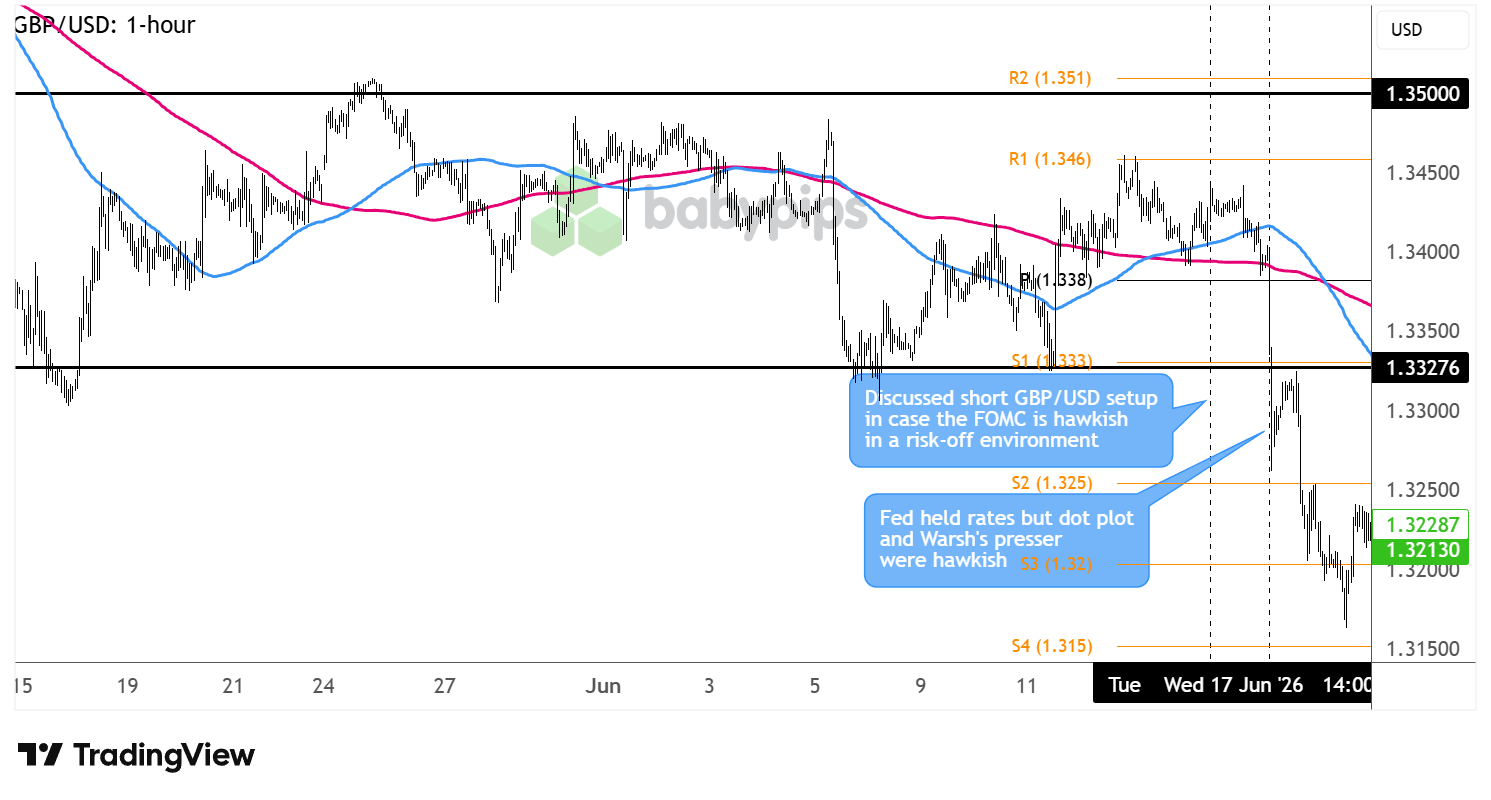
The GBP/USD bearish setup required the hawkish FOMC to land in a risk-off macro environment. The event condition was clearly met, as Warsh’s dot plot and presser gave dollar bulls exactly what the watchlist anticipated.
However, the broader risk environment for the week was cautiously risk-friendly, driven by ongoing U.S.-Iran peace optimism and the advancing MOU framework. The risk-off that emerged on Wednesday was a direct product of the hawkish FOMC itself, not an independent macro backdrop the setup had in mind, so the GBP/USD discussion did not satisfy both required conditions to move beyond the watchlist stage.
The pair still fell sharply, breaking from around 1.3380–1.3420 ahead of the FOMC through S1 (1.3322) and later S2 (1.3251), reaching lows near 1.3150 by Friday. Multiple bearish GBP catalysts accumulated independently: the U.K. CPI miss at 2.8% year-over-year on Wednesday trimmed BOE hike urgency before the event, and the BoE’s 7-2 hold on Thursday confirmed the majority’s patience despite two dissenters calling for an immediate move.
The directional thesis held up clearly, and a short GBP/USD would very likely have been profitable. But the price reaction was mainly from sterling-specific fundamental weakness (soft CPI, a cautious BOE majority) reinforced by hawkish dollar tailwinds, rather than the generalized risk-off backdrop the setup originally required.
Traders who built the case around those cross-pair dynamics had a legitimate adapted argument, though the watchlist discussion as framed just did not match the prevailing risk environment.
AUD/USD: Bearish USD Event Outcome + Risk-On Scenario
AUD/USD 1-hour Forex Chart Faster with TradingView
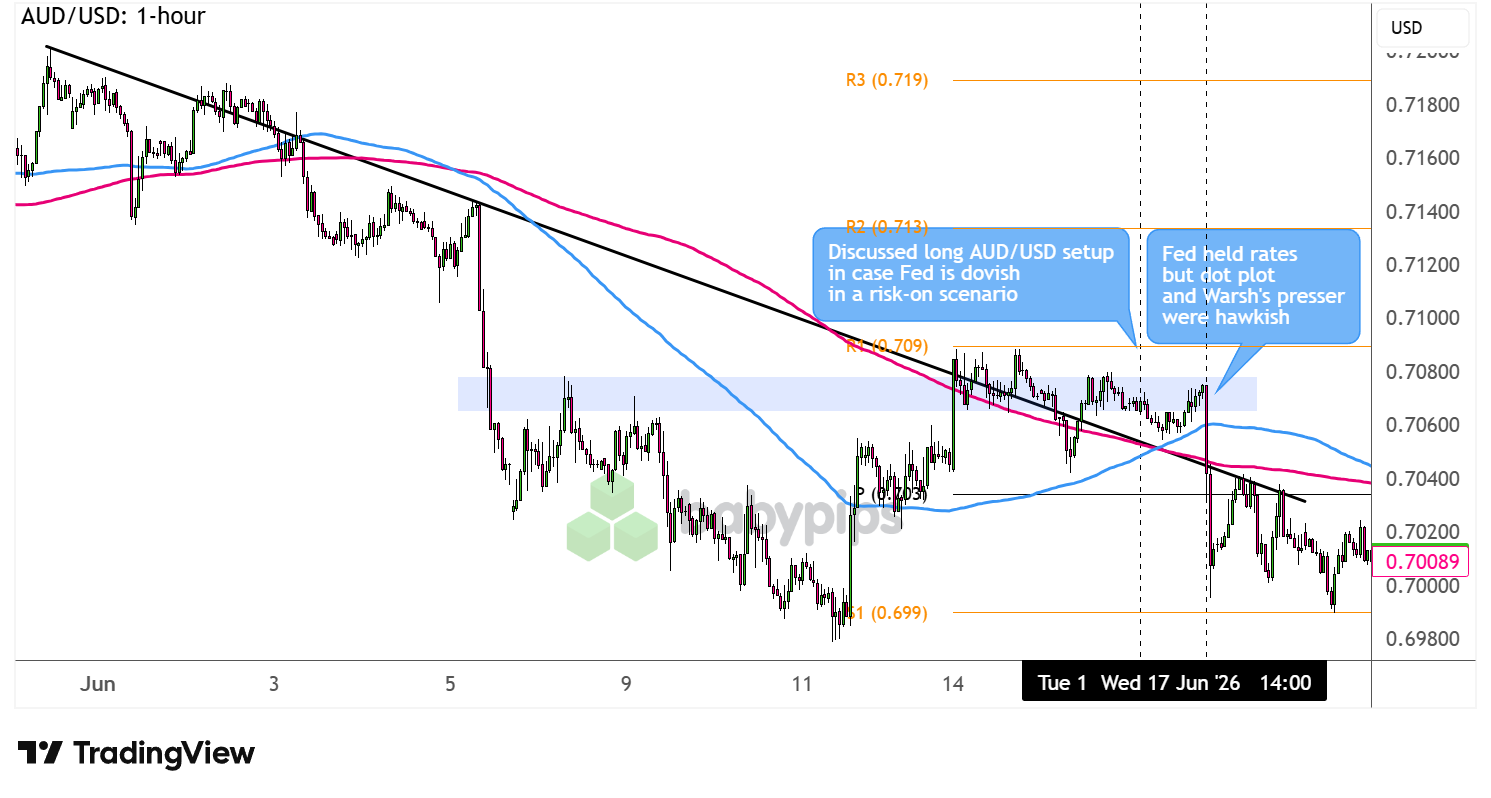
This watchlist idea looked into a potential trend line breakout and reversal in case the Fed takes a less hawkish tone in a risk-on scenario.
However, the RBA’s unanimous pause at 4.35% — fully priced and accompanied by no hawkish surprise at the press conference — had removed a potential AUD tailwind before the FOMC even fired, leaving the pair without domestic support when the hawkish dot plot hit. Though the risk-on backdrop was present early in the week, the FOMC outcome directly contradicted the trade’s core premise, and the AUD/USD discussion did not satisfy both required conditions to move beyond the watchlist stage.
Though the risk-on backdrop briefly lifted the Aussie early in the week, this offered no lasting protection once rate-hike repricing began overriding geopolitical optimism.
AUD/USD rejected from the trend-line area near R1 (0.7090) and slid through the pivot point (0.7043) toward S1 (0.6988), closing Friday near 0.7013.
Traders who adapted to the actual outcome could have flipped their bias to a reassessed short case: the descending trend-line rejection near R1 (0.7090) was the technical trigger, and the FOMC hawkish confirmation was the fundamental catalyst.
A short entry at or below the pivot point (0.7043), where the pair failed to hold, with S1 (0.6988) as the initial target, would have been a clean adjustment. The pair’s continued slide toward 0.7000 through the end of the week confirmed the directional follow-through without a meaningful counter-rally.
USD/JPY: Bearish USD Event Outcome + Risk-Off Scenario
USD/JPY 1-hour Forex Chart Faster with TradingView
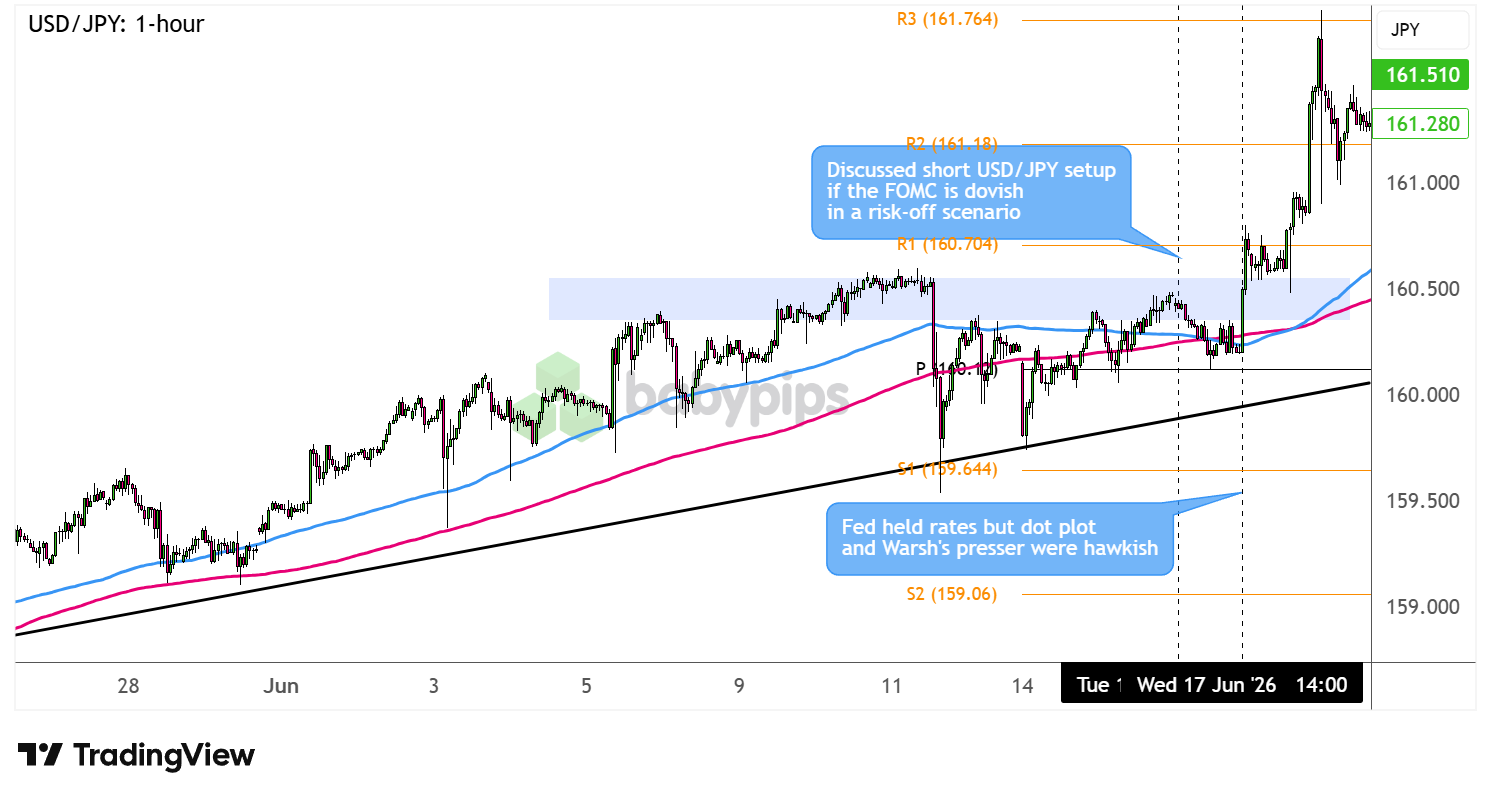
This USD/JPY trade idea looked into a possible resistance rejection off the 160.00-160.50 yen-tervention zone in the event that the FOMC leans dovish in a risk-off environment. However, the target event turned out to be the opposite as the Fed’s dot plot and presser pointed to stronger odds of a hike rather than a cut soon.
In addition, the BOJ’s 7-1 hike to 1.00%, which the watchlist cited as a potential yen tailwind, produced no lasting JPY strength because the move was nearly fully priced ahead of the decision, and Deputy Governor Uchida’s deliberately neutral press conference offered no additional hawkish signal to sustain it.
This, in combination with the lack of verbal or actual intervention as the pair tested critical levels, left USD/JPY entirely exposed to the FOMC’s hawkish repricing with little domestic counter-force from the yen’s side. With both the event outcome and the macro backdrop working against the thesis, the USD/JPY discussion did not satisfy the required conditions to move beyond the watchlist stage.
Instead, USD/JPY surged from the 160.20–160.40 area through R1 (160.681) and R2 (161.169) to highs near 161.80 on Thursday before pulling back to around 161.26 into Friday.
For traders adapting to the actual outcome, a long USD/JPY on post-FOMC confirmation was the directionally logical reassessment: the break above R1 (160.681) was the entry trigger, with R2 (161.169) as the natural first target.
The Verdict
USD/CHF moved precisely as the watchlist’s bullish USD scenario laid out, with two of its key conditions materializing in sequence: the Fed’s hawkish dot plot firmed the dollar’s rate differential, and the continued Iran peace progress paired with the SNB’s dovish hold kept CHF’s safe-haven appeal suppressed rather than bid.
The result was a sustained two-session advance that reached and exceeded the watchlist’s anticipated targets, with limited ambiguity about direction at any point.
Keep in mind that USD/CHF’s post-FOMC rally benefited from an unusually concentrated confluence: a hawkish Fed, a simultaneously dovish SNB, and a fading geopolitical risk premium all pointing in the same direction within a 48-hour window.
Setups where multiple independent catalysts align across the same trade rarely offer clean repeats, and the initial FOMC spike moved quickly enough that traders without pre-set entry levels risked chasing from a compressed risk/reward starting point.
Overall, we’d rate this USD/CHF discussion as highly likely supportive of a net positive outcome. The directional thesis was right, execution levels were well-defined and accessible at the relevant support zone, and the trend was extended by confirming catalysts across Thursday’s session.
The primary caveat is entry timing: those positioned near the 38.2% Fib / S1 zone ahead of the FOMC, or on an immediate post-statement confirmation, had the cleanest path to a profitable trade. Those chasing the initial spike faced a tighter window, though the second leg higher provided a more meaningful follow-through.
Promoted: The Strategy is Half the Battle; Your Mindset is the Rest.
Most trading mistakes aren’t technical—they’re psychological. In the classic “Trading in the Zone” by Mark Douglas (⭐ 4.7★ | 10,000+ reviews on Amazon), you’ll learn how to master the probabilistic thinking and emotional discipline mentioned in today’s article. If you struggle with hesitation or breaking your rules, this is your manual for consistent execution.
Click on the link to learn more about “Trading in the Zone” by Mark Douglas!
Disclosure: To help support our content, we may earn a commission from our partners if you sign up through our links, at no extra cost to you.
Key Takeaways:
A Hawkish Hold Can Move Markets More Than a Rate Change
When a central bank holds rates but shifts its projected path materially higher, the surprise element can be sharper than an actual rate move, because it resets expectations rather than confirming what was priced.
Warsh’s press conference, plus nine officials penciling in 2026 hikes with PCE forecasts revised to 3.6%, produced exactly that dynamic, delivering a clean and sustained dollar rally from a market positioned for a neutral-to-dovish tone. Tracking what the market has priced for the tone, not just the rate decision, is the more relevant preparation before a central bank event.
Policy Divergence Compounds When Two Central Banks Move in Opposite Directions Simultaneously
USD/CHF’s advance was extended not just by the hawkish Fed, but by the SNB’s dovish hold the following day. When two central banks shift their policy signals in opposing directions within the same week — one raising inflation forecasts and flagging hikes, the other adding “if necessary” intervention language read as dovish — the resulting move in the relevant pair tends to be larger and more persistent than a single-catalyst setup.
Mapping the full central bank calendar around a target event, not just the primary decision, can meaningfully expand a setup’s expected payout and inform whether to hold a position into the following session.
Entry Timing Around High-Impact Events Rewards Pre-Set Level Clarity
The cleanest entry for USD/CHF was at the 38.2% Fib / S1 zone around 0.7920 — a level identified in the watchlist before the event fired. When a high-impact central bank decision confirms direction sharply, the initial move tends to be fast and one-sided; traders who have their entry levels mapped in advance can act decisively on the confirmation rather than recalibrating on the fly.
Entering without pre-set levels typically means joining the trade later, at worse prices, with the initial risk/reward already partially consumed by the spike.
The June FOMC delivered a hawkish hold that caught many traders off guard, and understanding why the dot plot mattered more than the rate decision itself is key to trading these events well. Premium members can read our lesson:
📖 How to Trade Central Bank Decisions Using Market Expectations
Reading this helps you understand what “priced in” really means, how to read market-implied probabilities before a Fed decision, and how to prepare for the four scenarios that play out when expectations and outcomes diverge.
And if you’re not a Premium subscriber yet, now’s a good time to sign up.
With Babypips Premium, you get full access to School of Pipsology lessons that help you understand not just what the Fed announced, but how to read the tone, the dot plot, and the press conference as a complete trading signal.


