





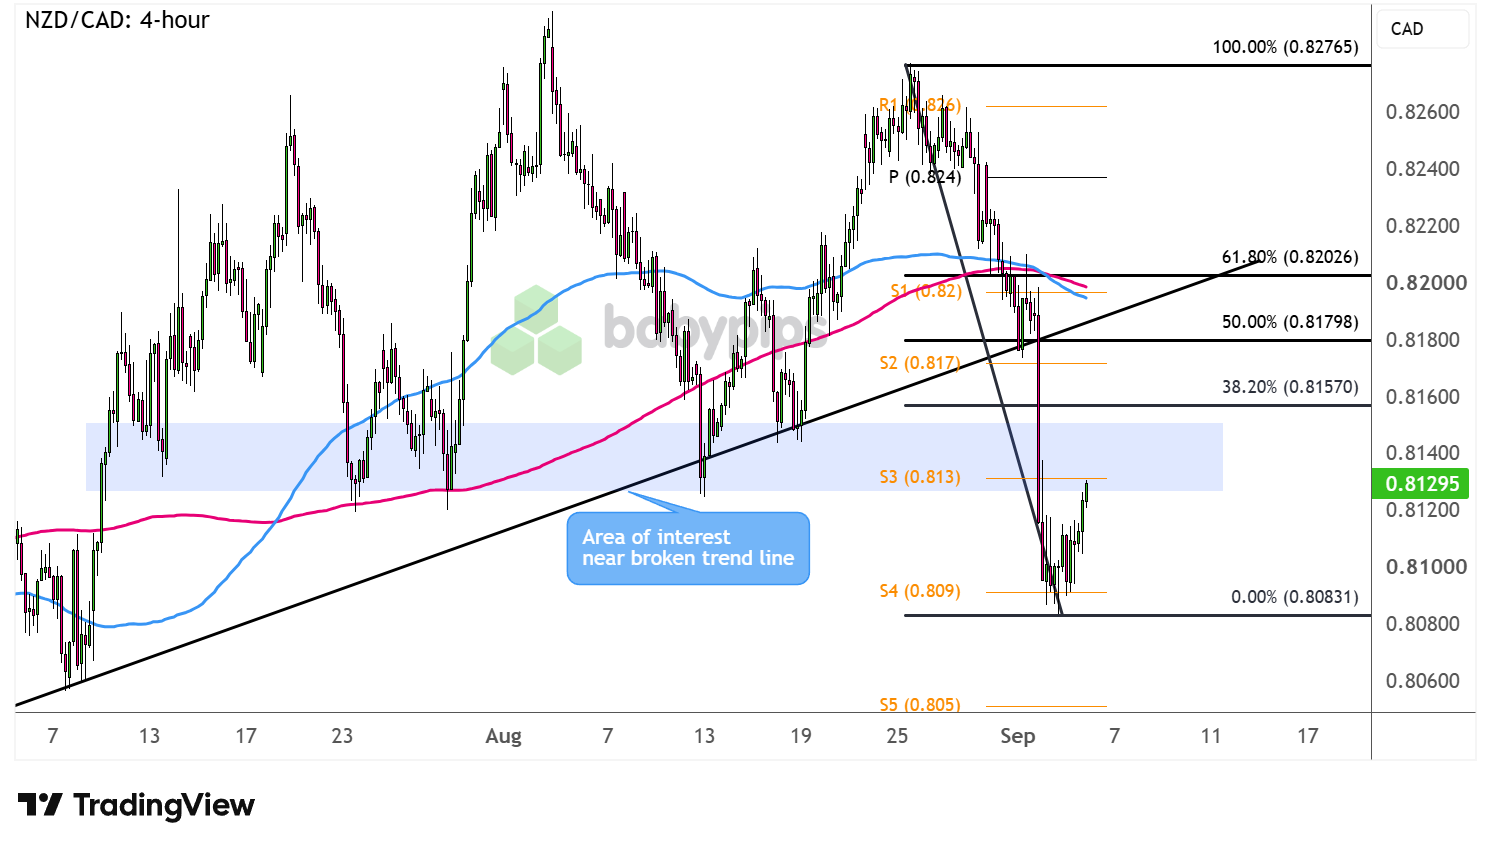
NZD/CAD recently fell through an ascending trend line, hinting at a likely reversal from the uptrend.
Can it find more sellers on a retracement?
Here are the inflection points to watch on the 4-hour chart.
NZD/CAD: 4-hour
NZD/CAD 4-hour Forex Chart Faster with TradingView
The contrast between a dovish RBNZ hike and a hawkish BOC hold sent NZD/CAD tumbling below the .8100 mark earlier this week.
New Zealand’s central bank framed the move as “gradually removing monetary stimulus” while reiterating that “the future OCR path is not pre-determined.” On the flip side, BOC Governor Macklem mentioned they could raise rates more than once if inflation remained elevated due to Middle East tensions.
Can NZD/CAD gather more bearish momentum on a pullback?
NZD/CAD is finding support at S4 (.8090) and is closing in on the area of interest or former support around S3 (.8130). A larger correction could reach the 38.2% Fib or the 50% level closer to the broken trend line and S2 (.8170).Remember that directional biases and volatility conditions in market price are typically driven by fundamentals. If you haven’t yet done your homework on the New Zealand dollar and the Canadian dollar, then it’s time to check out the economic calendar and stay updated on daily fundamental news!
Keep your eyes peeled for reversal candlesticks at any of these areas, as a continuation of the slide could take the pair back down to the swing low or to fresh bearish targets closer to S5 (.8050).
On the other hand, a sharp recovery rally surging past the 61.8% Fib and the .8200 handle at S1 could put the longer-term climb back in play.
Whichever bias you end up trading, don’t forget to practice proper risk management and stay aware of top-tier catalysts that could influence overall market sentiment.
Please be aware that the technical analysis content provided herein is for informational and educational purposes only. It should not be construed as trading advice or a suggestion of any specific directional bias. Technical analysis is just one aspect of a comprehensive trading strategy. The technical setups discussed are intended to highlight potential areas of interest that other traders may be observing. Ultimately, all trading decisions, risk management strategies, and their resulting outcomes are the sole responsibility of each individual trader. Please trade responsibly.
This setup breaks NZD/CAD’s move down into Fibonacci levels, pivot-style support zones, and a broken trend line, but telling a genuine reversal apart from a temporary retracement takes more than watching one chart. Premium members can read our lesson:
📖 How to Identify Reversals and Retracements
Reading this helps you understand how Fibonacci levels, pivot points, and trend lines work together to signal whether a pullback like the one forming near NZD/CAD’s S3 and S2 zones is likely to hold or fail, and why waiting for confirmation matters more than guessing the bias.
And if you’re not a Premium subscriber yet, consider joining.
With Babypips Premium, you get full access to School of Pipsology lessons that help you understand not just where price is bouncing on the chart, but which tools separate a real reversal from a pullback that’s about to run out of steam.



