





Trend warriors huddle up!
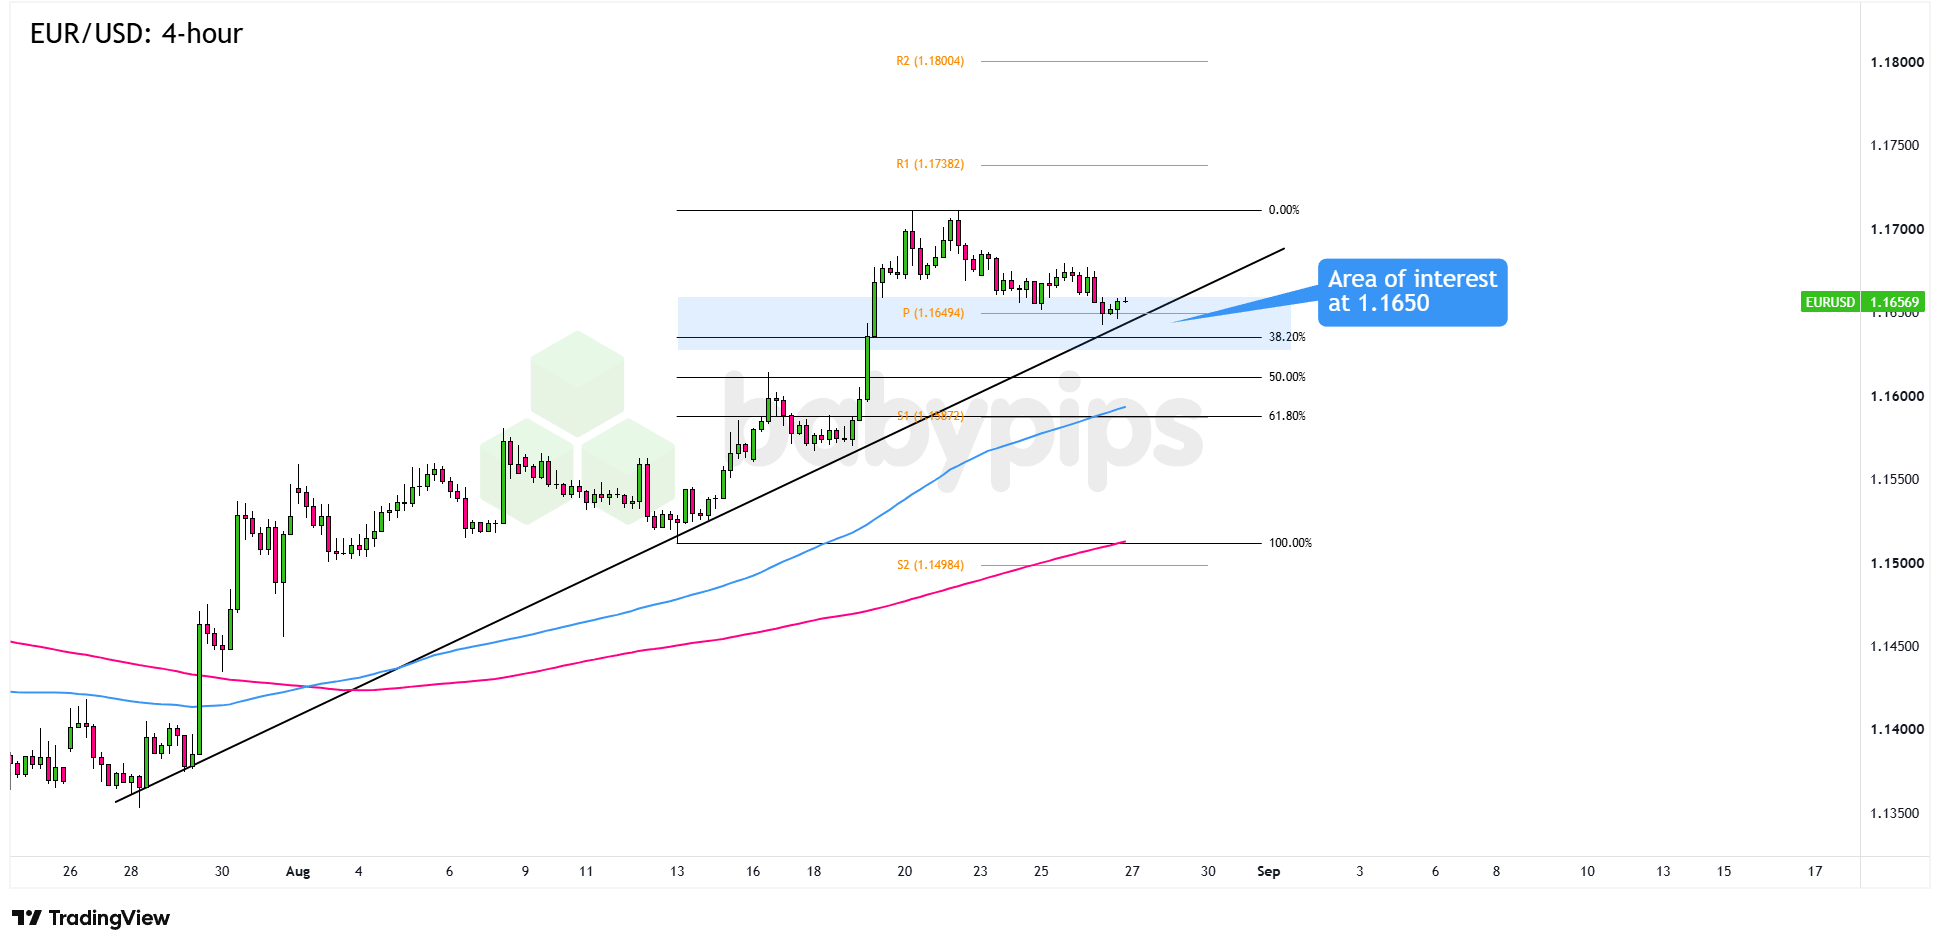
EUR/USD has been pulling back from recent highs and is now testing a busy support zone near 1.1650.
Will the trend bend this week? Or will the bulls push for fresh weekly highs ahead of the Jackson Hole weekend?
EUR/USD: 4-hour
EUR/USD 4-hour Forex Chart Faster with TradingView
ECB’s Isabel Schnabel gave the euro a lift this week after reiterating that rates need to rise further, pointing to sticky Euro Area inflation and an economy that’s holding up better than expected. With the ECB leaning hawkish and broader fundamentals still favoring the euro, buyers may not need much of an excuse to jump back in.
The U.S. dollar’s next big test comes Friday, when Fed Chair Kevin Warsh takes the stage at Jackson Hole for his first major speech. Markets are split roughly 60/40 on whether the Fed will stand pat in September, so there’s plenty of room for a dollar pullback if Warsh strikes a measured tone.
EUR/USD’s uptrend from late July is still intact, and the pair has pulled back into a support zone with several technical levels lining up.Remember that directional biases and volatility conditions in market price are typically driven by fundamentals. If you haven’t yet done your homework on the euro and the U.S. dollar, then it’s time to check out the economic calendar and stay updated on daily fundamental news!
The Pivot Point at 1.1649 sits near the 38.2% Fibonacci retracement of the recent upswing, while the rising trendline runs right through the same area. That makes the 1.1650 zone the key level to watch for signs of fresh demand.
If buyers step back in and bullish candlesticks begin holding above 1.1650, EUR/USD could be gearing up for another run at the 1.1700 previous highs. The R1 at 1.1738 and R2 at 1.1800 would be the bigger targets if the bulls really start pressing.
On the flip side, bearish candlesticks and a sustained break below the trendline could drag EUR/USD toward the S1 Pivot Point, followed by the 100 SMA if the slide picks up steam.
Whichever bias you end up trading, don’t forget to practice proper risk management and stay aware of top-tier catalysts that could influence overall market sentiment!
This EUR/USD chart analysis builds its case around a zone at 1.1650 where a Pivot Point, Fibonacci retracement, and rising trendline all converge, a setup technique you may not have studied formally. Premium members can read our lesson:
📖 Confluence: Stacking the Odds in Your Favor
Reading this helps you understand how multiple technical factors at the same level create a stronger setup, how to evaluate those factors before entering a trade, and why the 1.1650 zone carries more weight than any single technical level on its own.
And if you’re not a Premium subscriber yet, now’s a good time to sign up.
With Babypips Premium, you get full access to School of Pipsology lessons that help you understand not just where key levels fall on a chart, but how to measure the quality of the technical case stacking behind them before you trade.



