





Three major catalysts competed for attention Wednesday: the Fed’s preferred inflation gauge, a Q2 GDP revision, and a Bloomberg report that Russia is preparing to escalate attacks on Ukraine after concluding peace talks have stalled.
Core PCE held at 3.3% year-over-year and came in slightly below the monthly forecast, doing little to change September rate hike odds while keeping a year-end move firmly on the table. The dollar closed the day as one of the top-performing major currencies. Oil whipsawed on the Ukraine-Russia news and finished well in the green, while gold posted one of its sharpest single-session drops of recent weeks.
Check out the forex news and economic updates you may have missed in the latest trading session!
News Headlines & Data:
- U.S. API Crude Oil Stock Change for August 21, 2026: 4.2M (-3.28M previous)
- Australia Westpac Leading Index for July 2026: 0.0% m/m (0.1% m/m forecast; 0.0% m/m previous)
- Australia Inflation Rate for July 2026: 3.5% y/y (3.2% y/y forecast; 3.8% y/y previous); 1.0% m/m (0.7% m/m forecast; -0.1% m/m previous)
- Swiss Economic Sentiment Index for August 2026: 12.1 (8.0 forecast; 10.0 previous)
- U.K. CBI Distributive Trades for August 2026: -48.0 (-21.0 forecast; -26.0 previous)
- U.S. MBA Mortgage Applications for August 21, 2026: -1.0% (-0.4% previous)
- U.S. MBA 30-Year Mortgage Rate for August 21, 2026: 6.78% (6.77% previous)
- U.S. Personal Income for July 2026: 0.4% m/m (0.2% m/m forecast; 0.2% m/m previous)
- U.S. Personal Spending for July 2026: 0.2% m/m (0.3% m/m forecast; 0.3% m/m previous)
- U.S. Durable Goods Orders for July 2026: 1.1% m/m (0.5% m/m forecast; 0.3% m/m previous)
- U.S. Core PCE Price Index for July 2026: 3.3% y/y (3.3% y/y forecast; 3.3% y/y previous)
- U.S. GDP Growth Rate 2nd Est for Q2 2026: 1.5% q/q (1.5% q/q forecast; 2.1% q/q previous)
- EIA Crude Oil Stocks Change for August 21, 2026: 0.1M (4.41M previous)
Broad Market Price Action:
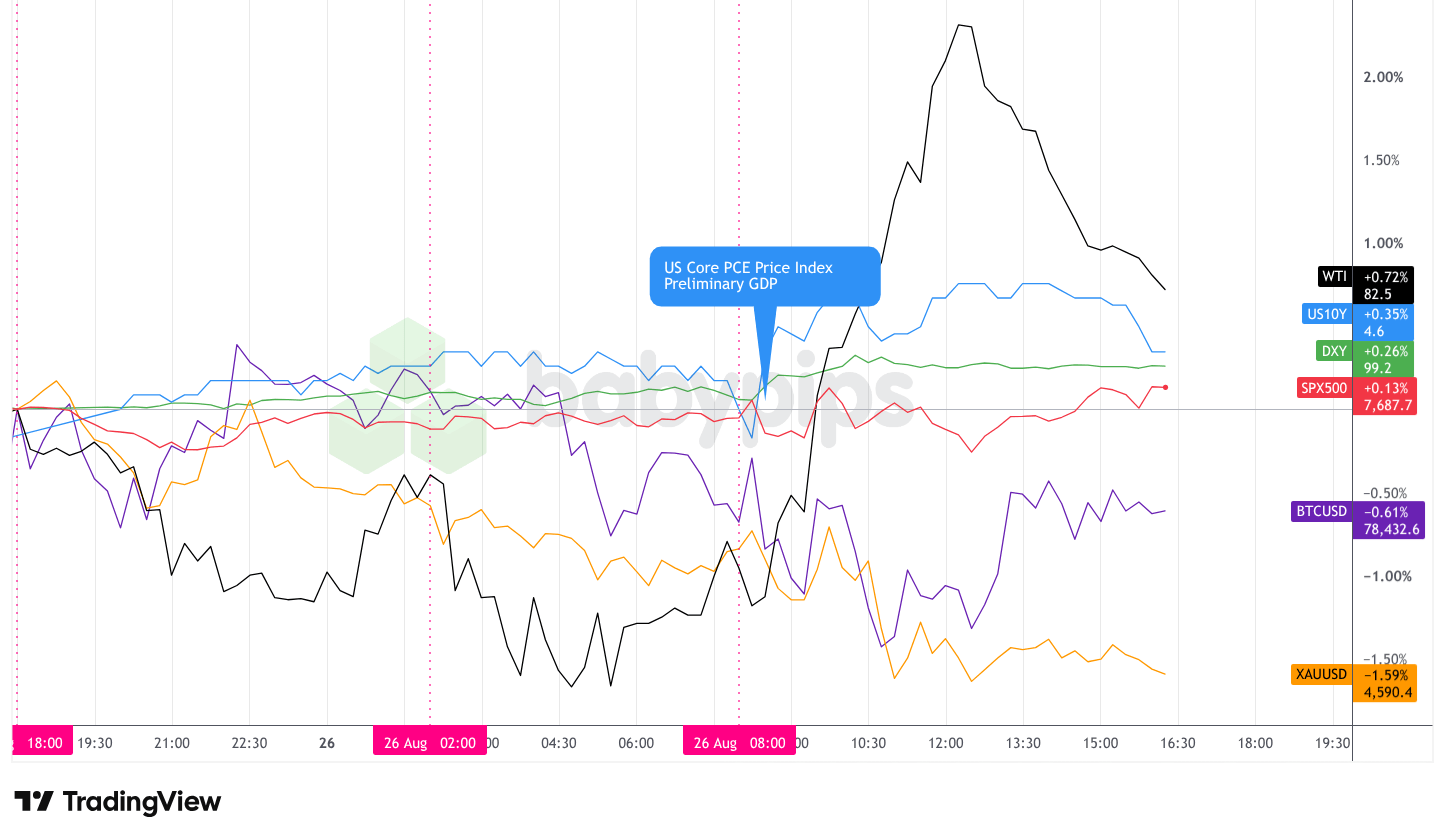
Dollar Index, Gold, Oil, S&P 500, U.S. 10-yr Yield, Bitcoin Overlay – Chart Faster With TradingView
Most assets held tight ranges through the Asian and London hours ahead of the 8:30 AM ET U.S. data block. The core PCE and GDP releases broke the quiet: oil surged while equities dipped on the open before recovering, and the session’s second leg came from a Bloomberg report that Russia is preparing to intensify attacks on Ukraine. By the close, oil led all assets on the broad market overlay, gold finished sharply lower, and the S&P 500 eked out a fractional gain.
The S&P 500 wavered for most of the session as traders held back ahead of Nvidia’s after-hours earnings. Analysts projected near-doubling of Nvidia’s revenue year-over-year, and the index spent most of the day caught between caution on the AI trade and a modest lift from the GDP revision’s stronger underlying details. The index closed near 7,688, up around 0.13% on the day. Money markets had fully priced in at least one Fed hike by December after the data confirmed inflation still sits above target while consumer spending stayed resilient even as the July monthly reading cooled.
Gold posted one of its sharpest single-session drops in weeks, finishing near 4,590 and down roughly 1.46%. The metal started drifting lower in Asia, accelerated through the London morning, and found a brief intraday bounce around the data releases before selling resumed. A firmer dollar and rising Treasury yields likely kept pressure on non-yielding assets through the afternoon. Gold had been trading near its highest levels in more than three months heading into the session, so some of the drop may also reflect profit-taking ahead of a potentially volatile Jackson Hole Friday.
WTI crude oil was the day’s most volatile asset and its top performer, closing near $82.46 and up roughly 0.85%. The move came in two distinct phases. Through Asia and most of the London session, oil drifted from the Asian open near $81.90 down to a session low around $80.30 before stabilizing. The data-release window brought an initial push, but the larger surge came when Bloomberg reported that Russia is moving to escalate attacks on Ukraine after concluding peace negotiations have reached a dead end. Prices ran toward $83.98 before pulling back; Ukraine’s drone strike on a Russian refinery in the Volga region added to supply-disruption concerns through the afternoon.
The U.S. 10-year Treasury yield edged higher on the session, closing near 4.67% and up around 0.37% on the day. After a quiet pre-data drift, yields climbed in response to the core PCE release, which held annual inflation at 3.3%, still well above the Fed’s 2% target. The GDP revision showed the Q2 GDP price index revised up to 6.4%, another signal of persistent price pressures.
Bitcoin closed near $78,432, down roughly 0.61% on the day. Early Asian trading pushed prices toward $79,242 before the London hours brought a sustained slide toward $77,592. The data releases triggered a brief spike and then a deeper flush to the session low. Bitcoin recovered toward $78,500 through the afternoon but faded into the close. No single crypto-specific catalyst drove the action, so the moves likely tracked the broader risk-off tone from rising yields and geopolitical headlines, consistent with the dominant macro theme of the day.
FX Market Behavior: U.S. Dollar vs. Majors
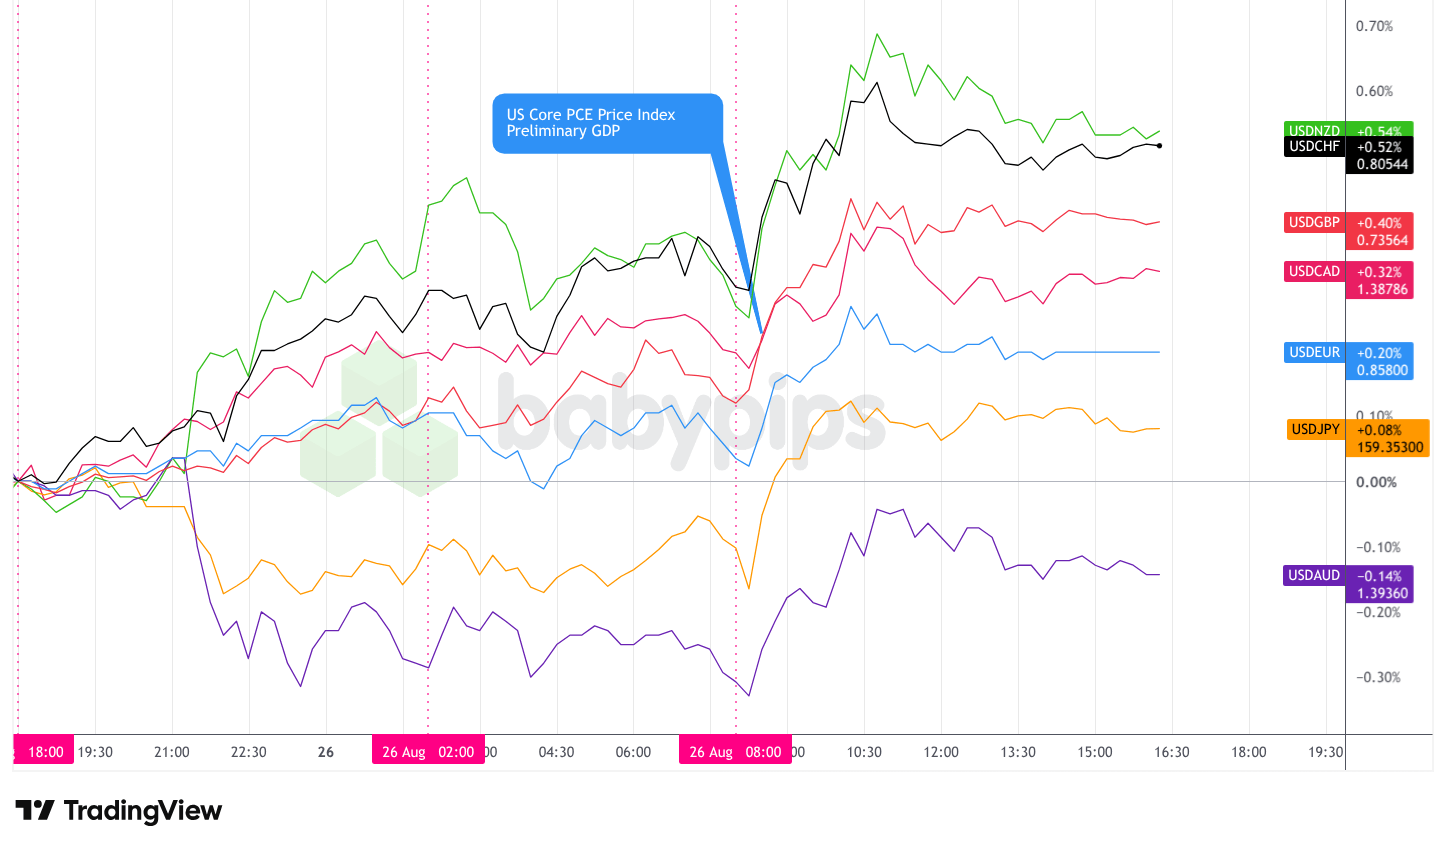
Overlay of USD vs. Major Currencies – Chart Faster With TradingView
The U.S. dollar traded with a net bullish lean across all three sessions Wednesday, finishing as one of the top-performing major currencies on the day.
During the Asian session, the dollar pushed higher against most majors from the 18:00 ET start. The moves were modest but broadly consistent, with USD/NZD and USD/CHF showing the most directional progress while USD/AUD and USD/JPY lagged. By the time Tokyo and Sydney trading handed off to the London open, the dollar carried a net gain against most currencies on the overlay, with a net bullish lean heading into Europe.
The London morning brought choppier conditions. The dollar dipped initially, then rebounded, then softened again toward the New York open. ECB Executive Board member Isabel Schnabel told Bloomberg in an early morning interview that interest rates must rise further, citing persistent inflation and a stronger-than-expected eurozone economy. Her comments likely gave the euro some support and contributed to the dollar’s mixed European session tone. The Swiss Economic Sentiment Index beat expectations sharply, printing 12.1 against a forecast of 8.0. The U.K. CBI Distributive Trades survey fell to -48.0, far worse than the -21.0 consensus, flagging a steep deterioration in British retail demand. Both readings added to a divergent cross-currency tone without shifting the dollar’s broader direction.
Once the U.S. session opened, the dollar rallied against all majors and held those gains through and just past the London close. Core PCE came in at 3.3% year-over-year, matching forecasts, with the monthly reading at 0.2% coming in below the 0.3% estimate. The GDP second estimate confirmed Q2 growth at 1.5%, but consumer spending was revised up to 3.4% annualized and business investment climbed at an 8.5% pace, both stronger than initially reported. The combination kept a year-end Fed hike on the table without locking in September.
After the London close, the dollar pulled back slightly and stabilized, drifting modestly lower into the 16:30 ET close without surrendering much of the session’s gains. USD/JPY finished the day as the smallest mover among the dollar’s gains, closing near 159.35 and up only around 0.08%. The yen’s muted response to a broadly bullish dollar day possibly reflected its safe-haven role absorbing some of the Ukraine escalation headlines.
Upcoming Potential Catalysts on the Economic Calendar
- U.S. Jackson Hole Symposium
- Australia Household Spending for July 2026 at 1:30 am GMT
- China Industrial Profits (YTD) for July 2026 at 1:30 am GMT
- Bank of Japan Himino Speech at 1:30 am GMT
- Germany GfK Consumer Confidence for September 2026 at 6:00 am GMT
- Swiss Non Farm Payrolls for June 30, 2026 at 6:30 am GMT
- Euro area Monetary Developments for July 2026 at 8:00 am GMT
- France Unemployment Benefit Claims for July 2026 at 10:00 am GMT
- ECB Monetary Policy Meeting Accounts at 11:30 am GMT
- Canada Average Weekly Earnings for June 2026 at 12:30 pm GMT
- U.S. Initial Jobless Claims for August 22, 2026 at 12:30 pm GMT
- U.S. Goods Trade Balance Adv for July 2026 at 12:30 pm GMT
- U.S. Wholesale & Retail Inventories Adv for July 2026 at 12:30 pm GMT
- U.S. Kansas Fed Manufacturing Index for August 2026 at 3:00 pm GMT
Wednesday’s data delivered broadly what markets expected: confirmation that inflation stays above the Fed’s target without forcing a September hike.
Attention now turns to Friday morning’s Jackson Hole keynote from Fed Chair Kevin Warsh, his first major speech since taking the role in May. Traders watching Wednesday’s PCE and GDP prints will want to know whether Warsh uses the Wyoming podium to validate or push back against the roughly one-in-three odds markets assign to a September move. A hawkish tone would likely extend the dollar’s recent gains and pressure gold further; a measured or neutral delivery could unwind some of those moves.
The Ukraine escalation headline arrived late in Wednesday’s session and may carry over into Thursday’s open, keeping oil and safe-haven currencies in focus.
Overnight, Australia household spending and China industrial profits could add near-term pressure on AUD and commodity-linked pairs before Thursday’s U.S. data block, which includes jobless claims, the advance goods trade balance, and the Kansas City Fed manufacturing index.
Stay frosty out there, forex friends!
Wednesday’s session demonstrated why watching stocks, bonds, commodities, and currencies in isolation leaves you blind to how markets actually move. Premium members can read our lesson:
📖 What Is Intermarket Analysis?
Reading this helps you understand how economic data flows through bond yields and equity sentiment to drive currency prices, why geopolitical shocks affect safe-haven pairs differently, and how to read the relationship between oil, gold, and the dollar before your chart even shows the move.
And if you’re not a Premium subscriber yet, consider joining for full access to this lesson and hundreds more.
With Babypips Premium, you get full access to School of Pipsology lessons that help you understand not just what the chart shows, but how central bank policy, geopolitical shifts, and asset class relationships move it



