





Australia’s headline CPI cooled to 3.5% in July but beat forecasts, while trimmed mean inflation held at 3.6% and posted its biggest monthly rise in a year.
With the RBA already warning about upside inflation risks, September hike odds more than doubled to 36%, and the chance of a move by February hit 94%.
Key Takeaways from Australia’s July 2026 Consumer Price Index
- Headline CPI: +3.5% (y/y); down from 3.8% in June; beat the 3.3% forecast
- Monthly CPI: +1.0% original, +0.6% seasonally adjusted; beat the 0.8% forecast
- Trimmed mean: +3.6% (y/y); unchanged from June; above the 3.5% forecast; +0.5% (m/m), the largest monthly rise in a year
- Weighted median: +3.6% (y/y); +0.4% (m/m)
- Housing (+5.0% y/y): Largest annual contributor; new dwellings +5.7%, rents +3.6% for a third straight month, electricity +6.1%
- Food and non-alcoholic beverages (+3.2% y/y): Meals out and takeaway +4.5%, driven partly by the July 1 minimum wage award increase
- Transport (+2.6% m/m; +1.6% y/y): Automotive fuel +7.5% in the month as federal excise relief began to unwind
- Recreation and culture (+2.6% y/y): Domestic holiday travel and accommodation +6.2% on school holiday demand
- Breadth signal: Discretionary CPI ex tobacco +1.5% (m/m); pressure extended beyond a single category
Link to official Australian Bureau of Statistics CPI release (July 2026)
Minutes from the RBA’s August meeting already showed that several members believed upside inflation risks could materialize and require more tightening.
Wednesday’s inflation report gave those concerns some teeth. The board had expected trimmed mean inflation to slow to 3.3% by year-end, but at 3.6% and unchanged from June, that target now looks tough without a meaningful slowdown in August and September.
Markets didn’t waste time. The odds of a September 28 to 29 rate hike jumped from 17% to 36%, while the chance of at least one hike by February 2027 climbed to 94%.
You’ve got the macro outlook down, but a great thesis needs a precise entry. Bring your weekly recap insights to life on TradingView’s Supercharts. Use professional-grade drawing tools and 100,000+ community indicators to identify the exact technical levels where the smart money is moving. Don’t just follow the trend—visualize it.
Market Reaction
Australian Dollar vs. Major Currencies: 5-min
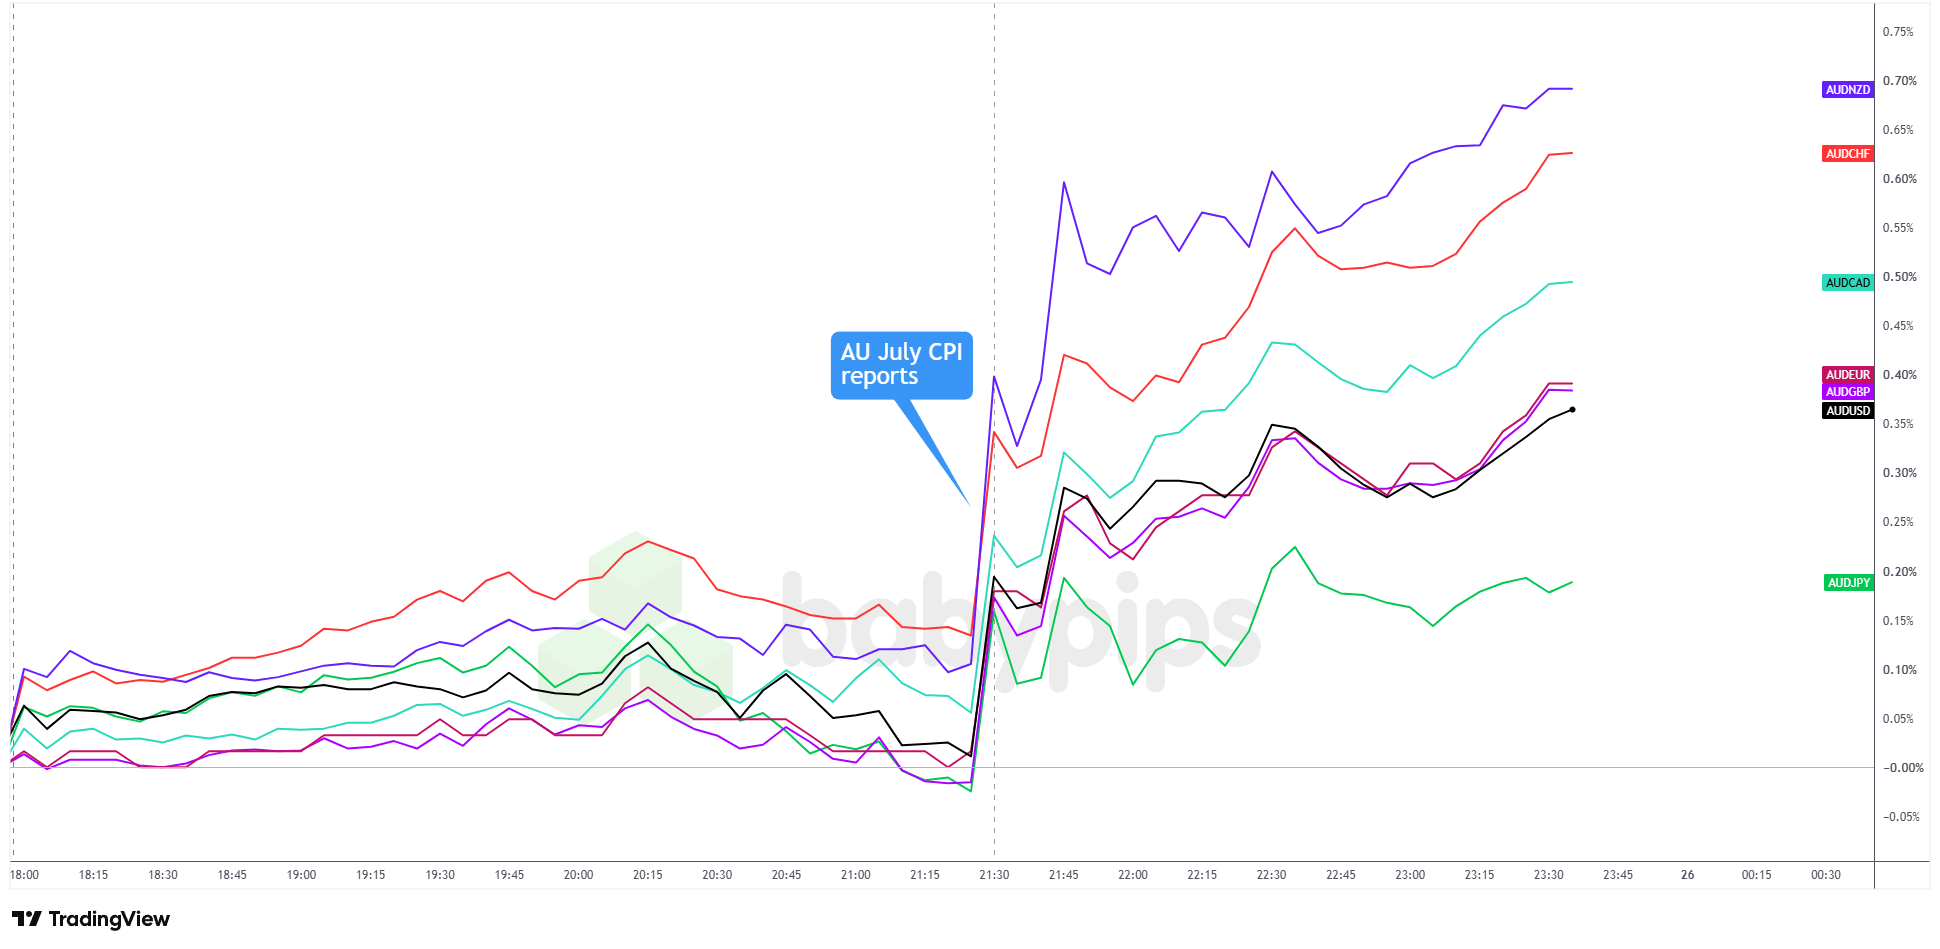
AUD vs. Major Currencies: 5-min Forex Chart Faster with TradingView
The data hit, and the move was immediate and one-directional. AUD spiked across every major pair within candles of the release and, unlike a typical knee-jerk move that fades, the gains extended through the session rather than reversing.
The broad-based AUD rally likely reflected markets repricing the RBA’s next move. A trimmed mean that beat consensus and held unchanged from June lifted the probability of a September hike from 17% to 36%, with the chance of a pre-February 2027 move jumping to 94%.
By session close, AUD was up across the board, gaining between 0.20% and 0.70% against all seven major pairs tracked.
Gains were largest against the New Zealand dollar (+0.70%) and Swiss franc (+0.63%), and more contained against the yen (+0.20%), the session laggard as cross-market yen demand capped the pair’s gains.
The Aussie also gained against the Canadian dollar (+0.48%), US dollar (+0.38%), euro (+0.39%), and pound (+0.39%). AUD/JPY dipped briefly below its pre-release level at the initial data cross before buyers stepped in and pushed the cross to session highs.
With the September 28-29 RBA meeting now in focus, traders will be watching Q2 GDP data due next week and whether the Middle East conflict keeps energy costs elevated and the upside inflation channel open through the August and September prints.
This article covers Australia’s July CPI surprise and the AUD’s post-release market reaction, but the mechanics of how price behaves around major data releases may not be familiar. Premium members can read our lesson:
📖 From Data to Price Action: What Happens When Big News Hits
Reading this helps you understand why AUD’s gains extended through the session instead of reversing, the difference between the initial algorithmic spike and the secondary analytical move, and how to recognize which type of post-release reaction you’re watching in real time.
And if you’re not a Premium subscriber yet, consider signing up.
With Babypips Premium, you get full access to School of Pipsology lessons that help you understand not just what the CPI numbers were, but the market mechanics that explain why the AUD moved the way it did after the release.



