





EUR/USD has clawed its way back from recent lows, but it’s now running into a thick wall of converging resistance that could have sellers perking up.
Will the bears defend this zone and push the pair back lower?
Check out these inflection points on the 4-hour chart!
EUR/USD: 4-hour
EUR/USD 4-hour Forex Chart Faster with TradingView
Softer U.S. inflation gave EUR/USD bulls some breathing room this week, with cooler CPI followed by a drop in PPI helping fuel the rebound. But the rally has started to lose steam. Treasury yields edged higher and the dollar regained ground as geopolitical risks flared, with fresh US strikes on Iranian military sites and uncertainty around Strait of Hormuz traffic keeping oil-driven inflation concerns alive.
The ECB’s message hasn’t offered much help either. Nagel called for continued vigilance on inflation and said policymakers need to keep their options open, while Moulin argued the bank is in a comfortable position after June’s hike and isn’t starting a new tightening cycle.
With the ECB divided and the Fed still sounding hawkish despite softer inflation, the euro is running short on fresh upside fuel.
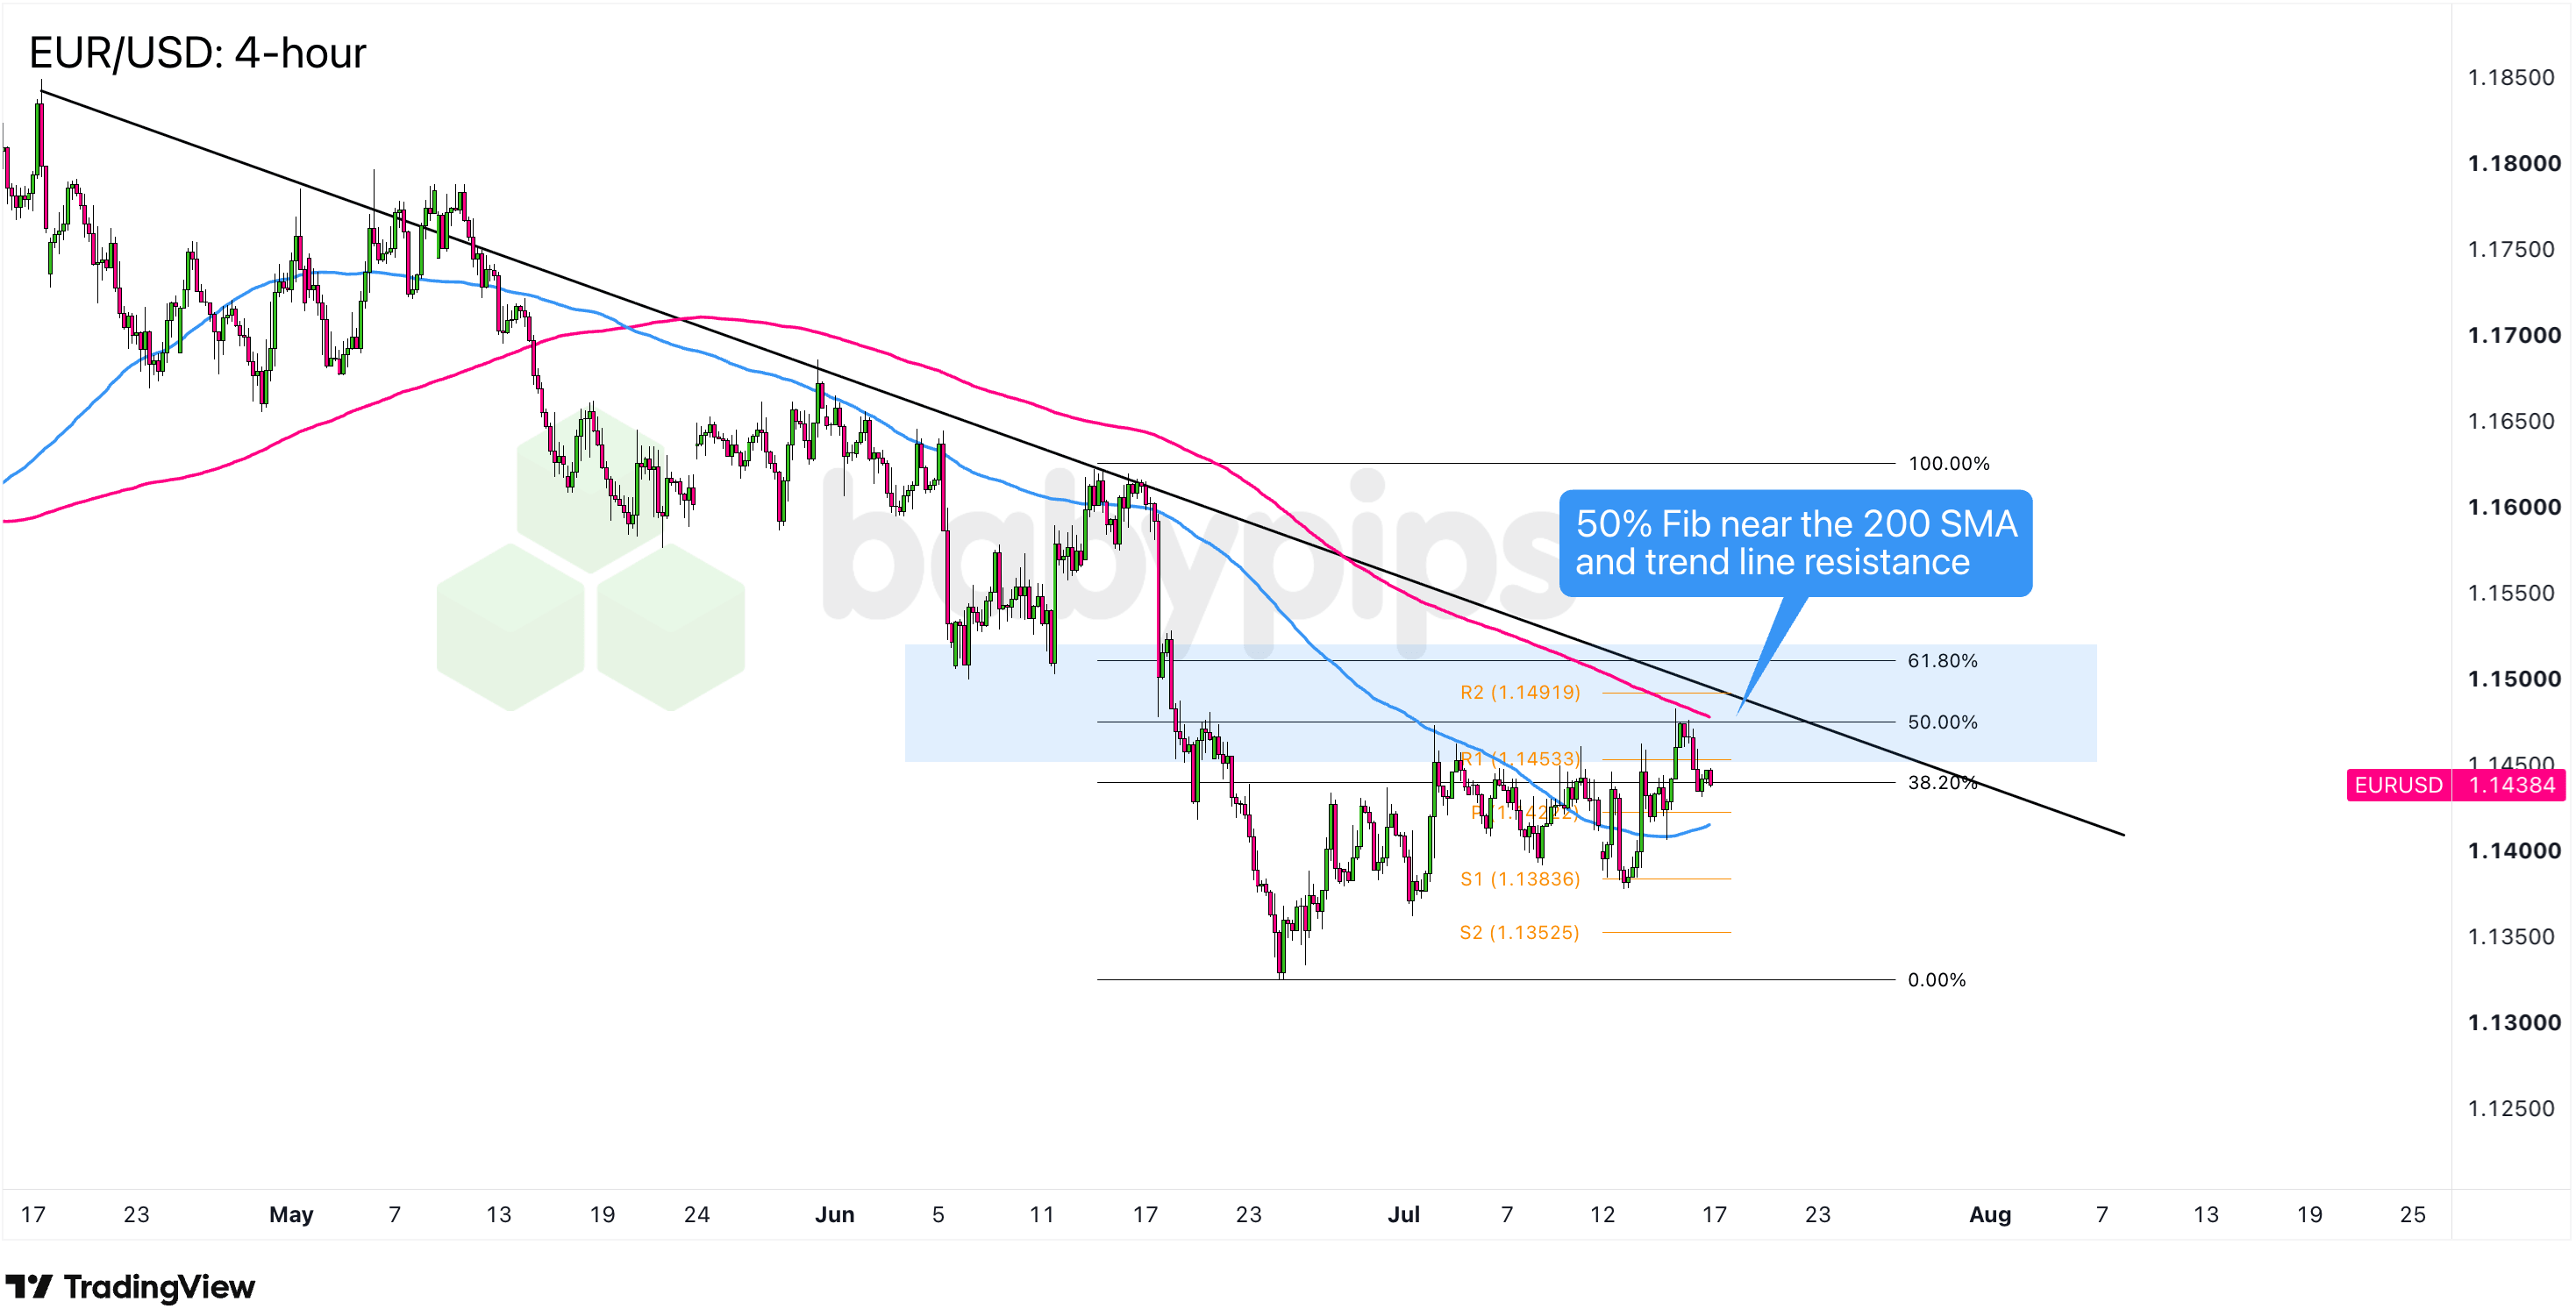
EUR/USD is now running into a tough resistance cluster where the 50% Fibonacci retracement, 200 SMA, and descending trend line converge between R1 at 1.1453 and R2 at 1.1492.Remember that directional biases and volatility conditions in market price are typically driven by fundamentals. If you haven’t yet done your homework on the euro and the U.S. dollar, then it’s time to check out the economic calendar and stay updated on daily fundamental news!
If sellers defend that zone, the first pullback target is S1 at 1.1384, followed by S2 at 1.1353 if bearish momentum picks up. Reversal candlesticks near the trend line or 200 SMA would offer an early sign that resistance is holding.
On the other hand, a convincing close above R2 at 1.1492 and the 61.8% Fibonacci level would put bears on the back foot and bring the 1.1500 psychological mark into focus.
Whichever bias you end up trading, don’t forget to practice proper risk management and stay aware of top-tier catalysts that could influence overall market sentiment!
This EUR/USD analysis is organized around a resistance cluster where the 50% Fibonacci retracement, 200 SMA, and a descending trend line all converge at the same price zone, and if the concept of overlapping technical factors is new to you, our lesson covers it directly. Premium members can read our lesson:
📖 Confluence: Stacking the Odds in Your Favor
Reading this helps you understand why multiple technical factors pointing at the same level create higher-conviction setups, how to identify and score confluence before taking a trade, and why a single isolated indicator is a much weaker signal than three aligned at the same zone.
And if you’re not a Premium subscriber yet, now’s a good time to sign up.
With Babypips Premium, you get full access to School of Pipsology lessons that help you understand not just what the chart is showing, but why multiple converging indicators at the same level create higher-probability trade setups.



