





Two days brought two softer inflation reports, but Fed Chair Kevin Warsh wasn’t ready to celebrate.
The first came Tuesday, when the Bureau of Labor Statistics reported that U.S. consumer prices fell 0.4% in June, the biggest monthly drop since the early days of Covid.
Ninety minutes later, Warsh appeared before Congress, where lawmakers expected him to welcome the result.
Instead, he reminded them that “it’s one data point” and made it clear the Fed wasn’t anywhere close to declaring victory. The dollar, which had sold off after the CPI release, recovered part of its losses within hours.
Then Wednesday delivered another soft reading. Wholesale prices fell 0.3% in June, reinforcing the idea that inflation pressures may be easing. Markets reacted quickly, with July rate hike odds dropping from roughly 50% to about 10% and the dollar giving back much of Tuesday’s recovery.
So what are these reports actually telling us, and why do traders need to watch both rather than just one?
What Did the June Inflation Data Actually Show?
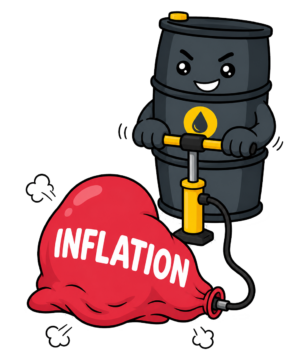 Two separate government reports released a day apart pointed to the same conclusion: U.S. inflation cooled in June.
The Consumer Price Index (CPI) measures what Americans pay for goods and services at the register. June’s reading fell 0.4% on the month, pulling the annual rate to 3.5% from 4.2% in May. That’s the first monthly decline in six years. Core CPI, which strips out food and energy prices to capture the underlying trend, was flat at 0.0% for the month. The annual core rate cooled to 2.6% from 2.9%.
The next day, the Producer Price Index (PPI) landed softer too. Final demand PPI fell 0.3% in June, the biggest monthly drop since April 2025, bringing its annual rate to 5.5% from 6.0%. Goods prices fell 1.4% for the month. Gasoline alone dropped 12%, accounting for roughly two-thirds of that decline. Core PPI came in at 0.2% monthly and 4.7% annually, below forecast.
Taken together, the reports suggest inflation pressures eased at both the consumer and producer levels. That’s why traders pay attention when CPI and PPI start telling the same story.
Why Do Both Reports Moving Together Mean More Than One Alone?
Think of it as a pipeline.
PPI measures prices near the beginning of the supply chain, when producers sell goods before they reach retailers.
CPI measures prices at the other end, when consumers pay for those goods at checkout. Prices move from the factory to the warehouse and eventually to store shelves, but those changes can take one to three months to work their way through the system.
That’s why one soft CPI report doesn’t always tell the whole story. It could reflect a temporary drop in consumer prices or weakness in just a few categories. But when PPI cools at the same time, it suggests price pressures are easing further up the supply chain as well.
In June, both ends of the pipeline moved in the same direction. That makes the slowdown harder to dismiss as a one-month fluke and gives the overall inflation signal more weight.
Promoted: Keep Your Trading Setup Ready for Data Day.
CPI, PPI, and Fed commentary can send the dollar swinging within minutes. ForexVPS keeps automated strategies running around the clock on low latency servers, so a weak home WiFi connection does not interrupt your trades when volatility hits.
Explore VPS plans at ForexVPS!
Disclosure: To help support our free daily content, we may earn a commission from our partners if you sign up through our links, at no extra cost to you.
Is This a Real Trend or Just an Energy Gift?
Energy did most of the heavy lifting in June. Gasoline prices fell 12% in the PPI report and accounted for nearly two-thirds of the decline in goods prices. Energy prices also dropped 5.7% in the CPI report.
Once those moves are stripped out, the inflation picture looks much less dramatic. Core CPI was flat rather than negative, while core PPI and services PPI both rose 0.2%.
There were also signs that businesses still have some room to raise prices. Trade service margins, which track what wholesalers and retailers earn on their sales, bounced back in June after falling sharply in May. That suggests pricing power may have recovered rather than disappeared.
Some categories closely watched by the Fed didn’t cool at all. Prices for electronic computers and equipment rose 2.5%, partly reflecting higher production costs tied to artificial intelligence investment. Several parts of the PPI report also feed directly into the Personal Consumption Expenditures price index, or PCE, which is the Fed’s preferred inflation gauge.
Some analysts see core PCE rising roughly 0.2% in June and 3.3% from a year earlier. That would still leave inflation well above the Fed’s 2% target, even if the broader trend continues to move in the right direction.
Oil remains the biggest wildcard. June’s energy relief came during a brief stretch of calmer tensions in the Middle East, but that window has already closed, and crude prices are climbing again.
If July brings a very different energy picture, some of June’s inflation progress could start looking temporary when the next reports arrive.
What Does This Mean for the Fed and the Dollar?
Markets didn’t waste much time reacting to the softer PPI report. The odds of a July rate hike plunged from roughly 50% to around 10%, while the US Dollar Index fell to a session low.
Still, Fed Chair Kevin Warsh managed to put a floor under some of the selling. The federal funds rate has been sitting between 3.50% and 3.75% since December, and about half of FOMC officials projected at least one more hike before the end of the year.
Warsh gave traders little reason to abandon that possibility. He acknowledged the softer June inflation numbers but called them just one data point, pushed back against the idea that the inflation fight was over, and offered no clues about when the Fed might move.
This lack of guidance matters. Warsh has stepped away from the Fed’s old habit of preparing markets well in advance, which means traders may get less warning than they did under previous chairs. When the data shifts, rate expectations can move quickly. As the past two days showed, they can reverse just as quickly.
The FOMC meets on July 28 and 29, and markets are now widely expecting the Fed to hold rates steady. September looks like the next meeting where a hike could come back into play, especially if higher oil prices begin feeding into the July CPI and PPI reports.
Traders will get the June PCE inflation report on July 30. If core PCE comes in near or below the estimated 0.2% monthly increase, the case for holding rates much longer remains strong. But if oil keeps climbing and June’s energy relief proves temporary, the Fed’s inflation problem could get complicated again in a hurry.
Quick Takeaways
- CPI fell 0.4% m/m in June (YoY: 3.5%), the biggest monthly drop in six years. PPI followed the next day, dropping 0.3%. Both were driven by a 12% gasoline collapse.
- When consumer and producer prices cool together, it suggests easing is appearing at multiple points in the supply chain, not just at one end. That makes the signal more meaningful than a single-report read.
- Strip out energy and the picture gets quieter. Core CPI was flat. Core PPI rose 0.2%. The underlying inflation trend is decelerating, not defeated.
- July Fed hike odds collapsed after the data, but Warsh’s pushback keeps September live, particularly if energy prices re-accelerate in July.
- The dollar weakened on the PPI print but found a floor after Warsh’s testimony. In a no-forward-guidance environment, data days can swing the dollar hard in both directions, sometimes within the same session.
Watch For
June PCE lands July 30 — the Fed’s actual inflation target, estimated at roughly 0.2% monthly and 3.3% annually, a major read just after the July 29 FOMC decision. The meeting itself is the next test of how Warsh communicates a hold without telling markets what comes next.
Beyond the calendar, watch oil. A sustained price re-acceleration in July would feed directly into the next CPI and PPI, and much of June’s relief would start to look like a one-month gasoline discount rather than a trend.
This article covers two back-to-back U.S. inflation reports that moved the dollar and rate expectations in ways that can seem counterintuitive without the right framework. Premium members can read our lesson:
📖 Market Expectations: Why Good News Can Tank a Currency
Reading this helps you understand why currencies move on the deviation from expectations, how rate hike odds translate into price action, and what it means when a market has already priced in a specific outcome before the data lands.
And if you’re not a Premium subscriber yet, now’s a good time to sign up.
With Babypips Premium, you get full access to School of Pipsology lessons that help you understand not just what the inflation numbers showed, but why the dollar’s reaction was driven by how far those numbers deviated from what markets had already priced in.



