





U.S. headline consumer prices fell 0.4% in June, marking the biggest monthly drop since April 2020 and coming in much weaker than the 0.1% decline economists expected.
Lower gasoline prices did much of the heavy lifting, but the softness wasn’t limited to energy. It showed up across a wide range of goods and services. Annual inflation slowed to 3.5% from 4.2% in May, its first decline since January.
Core prices, which exclude food and energy, were unchanged in June, while markets had expected a 0.2% increase. That pushed the annual core inflation rate down to 2.6% from 2.9%.
With both the headline and core readings missing forecasts by a wide margin, traders quickly backed away from July Fed rate hike expectations.
Key Takeaways
- Headline CPI: -0.4% (m/m), largest monthly drop since April 2020; 3.5% (y/y), down from 4.2%
- Core CPI: 0.0% (m/m); 2.6% (y/y), down from 2.9%
- Energy: -5.7% (m/m); gasoline: -9.7% (m/m)
- Shelter: +0.1% (m/m), smallest gain since January 2021; +3.3% (y/y)
- Food: +0.2% (m/m); +3.0% (y/y)
- Used cars and trucks: -0.2% (m/m); apparel: -0.6% (m/m)
- Motor vehicle insurance: -2.0% (m/m); medical care services: -0.1% (m/m)
Link to official U.S. CPI Reports (June 2026)
Gasoline did most of the work, plunging 9.7% in June as the U.S.-Iran ceasefire allowed crude to retreat from its spring highs. The broader energy index fell 5.7%, easily offsetting modest increases in food and shelter.
More importantly, the weakness was widespread. Shelter rose just 0.1%, its smallest gain since January 2021, while used cars, apparel, auto insurance, and medical care all declined. Recreation was the only major category showing real strength, rising 0.5%.
Core prices were flat for the first time in more than five years, removing the clearest case for a rate hike at the Fed’s July 28-29 meeting. Fed Chair Kevin Warsh said policymakers had “no tolerance” for persistently high inflation but gave no hint about the next move. Traders quickly cut July hike odds from about 40% to below 20%.
Still, the relief may not last. Fresh U.S. strikes on Iran pushed crude back above $86 per barrel, while pump prices have already risen from June’s lows. Any further escalation around the Strait of Hormuz could erase much of June’s energy-led improvement by the next inflation report.
Promoted: Can Your Strategy Handle a Fast Dollar Repricing?
Soft CPI data can send the Greenback moving in seconds. FTMO gives traders access to free trials, no time limits, and up to $200K in Demo Capital to test whether their risk management holds up when markets get volatile.
Start a free trial with FTMO!
Disclosure: To help support our content, we may earn a commission from our partners if you sign up through our links, at no extra cost to you.
Market Reactions
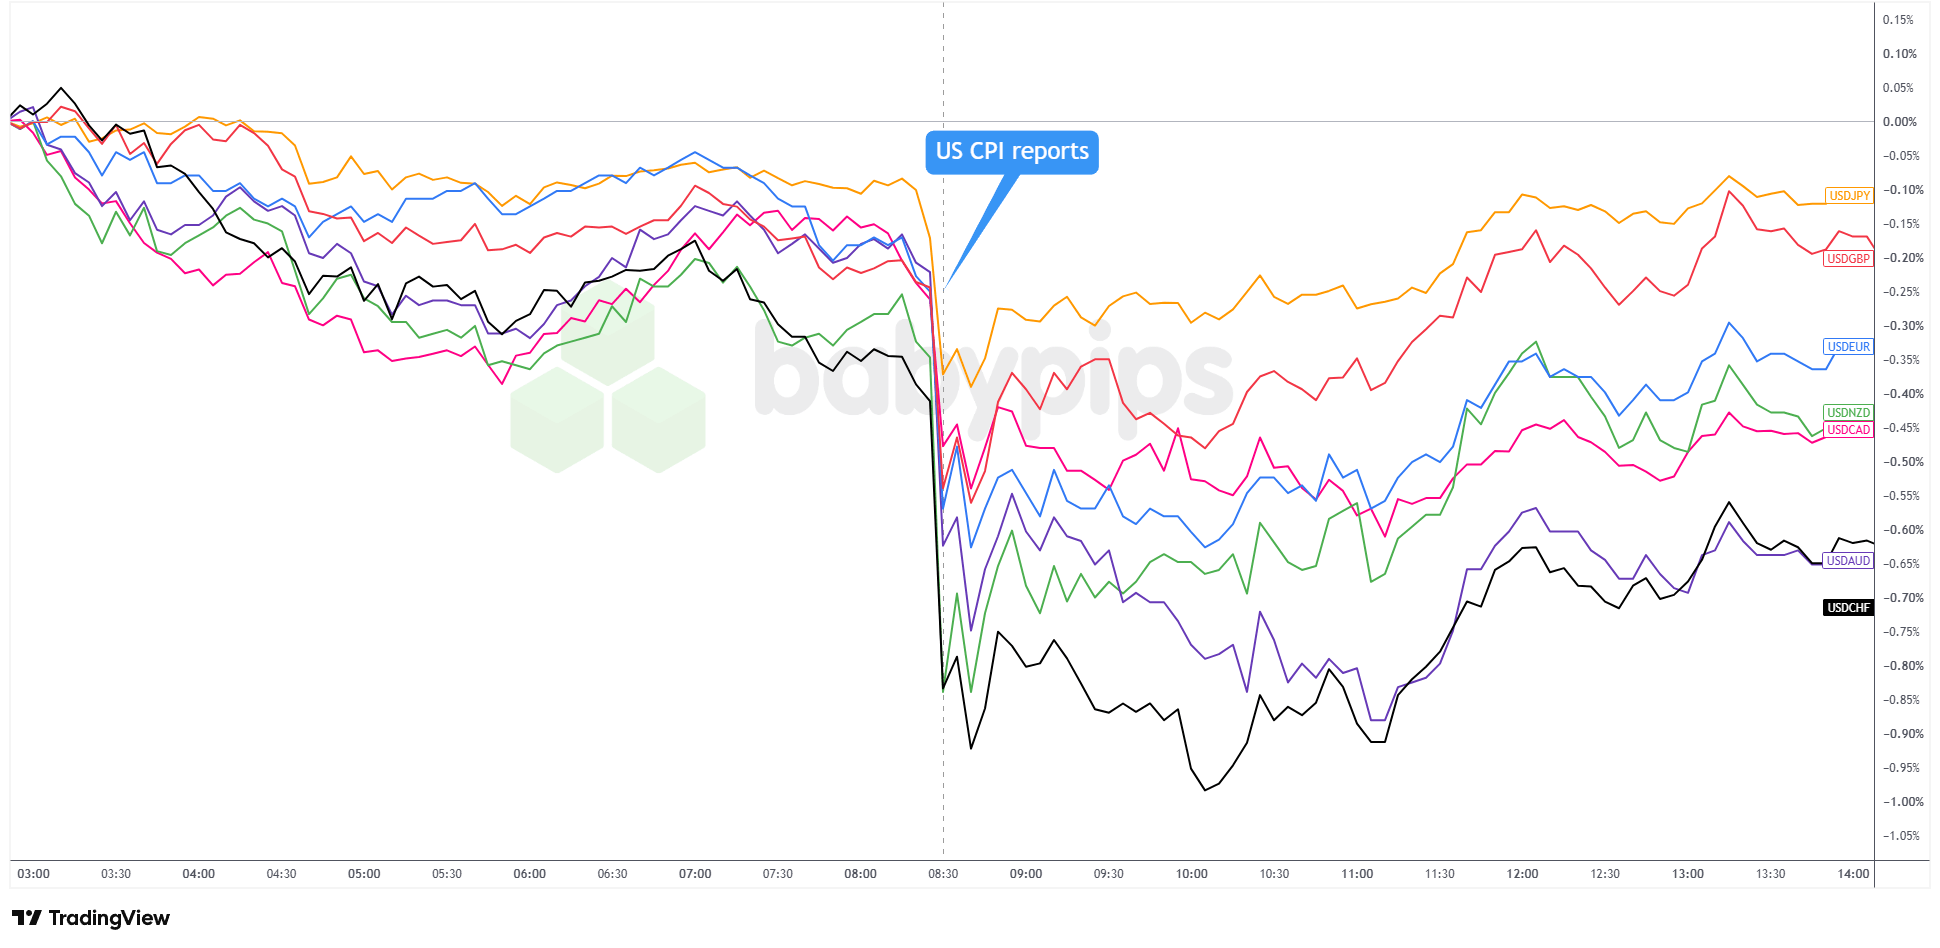
U.S. Dollar vs. Major Currencies: 5-min
USD 5-minute Forex Chart Faster with TradingView
The CPI report triggered an immediate selloff across the board. USD/CHF took the biggest hit, falling about 0.90% on the session, while USD/AUD also dropped sharply. USD/GBP and USD/JPY saw smaller losses, likely reflecting the higher rate hike expectations still priced into those crosses.
The Greenback recovered part of the move through mid-U.S. session as Fed Gov. Warsh’s hawkish but guidance-free testimony gave traders little reason to keep selling. Still, the rebound only erased part of the initial drop.
By the New York close, USD/NZD led losses at about 1.10%, followed by USD/AUD and USD/CHF at roughly 0.70% to 0.80%. USD/CAD finished down around 0.70%, USD/EUR 0.40%, USD/GBP 0.30%, and USD/JPY just 0.18%.
The FOMC meets July 28 and 29, with markets now assigning less than a 20% chance of a rate hike after the soft June CPI report.
The main question is whether renewed U.S.-Iran hostilities reverse June’s energy-driven disinflation quickly enough to change the Fed’s calculus. The next US CPI report, covering July, is due Wednesday, August 12, 2026.
The June CPI report came in well below consensus on both headline and core, and the dollar’s sharp selloff had more to do with how far the numbers missed expectations than with the figures themselves. Premium members can read our lesson:
📖 Market Expectations: Why Good News Can Tank a Currency
Reading this helps you understand why currencies react to expectation misses rather than the data itself, how traders price in economic outcomes before a release, and why a soft CPI print can trigger a sharp dollar selloff even when inflation is still running above the Fed’s target.
And if you’re not a Premium subscriber yet, now’s a good time to sign up.
With Babypips Premium, you get full access to School of Pipsology lessons that help you understand not just what the CPI numbers showed, but why the gap between the actual data and market expectations is what drove the dollar’s reaction.



