


EUR/USD just ran into resistance near a key psychological level and is now drifting back toward a cluster of potential support.
Could bulls step back in here, or is there more downside ahead?
Here’s what we’re seeing on the 4-hour time frame:
EUR/USD: 4-hour
EUR/USD 4-hour Forex Chart Faster with TradingView
The dollar started the week under pressure as last week’s soft U.S. data encouraged traders to trim Fed rate hike bets. However, Iran’s detention of a tanker owned by a UAE company near the Strait of Hormuz renewed Middle East tensions and helped the dollar recover some ground before the close.
Looking ahead, the ECB’s Lane is scheduled to speak alongside ZEW sentiment data for Germany and the Euro Area. A hawkish tone or stronger sentiment readings could give the euro another lift, while further escalation around the Strait of Hormuz or a shift in Fed expectations could keep the dollar supported.
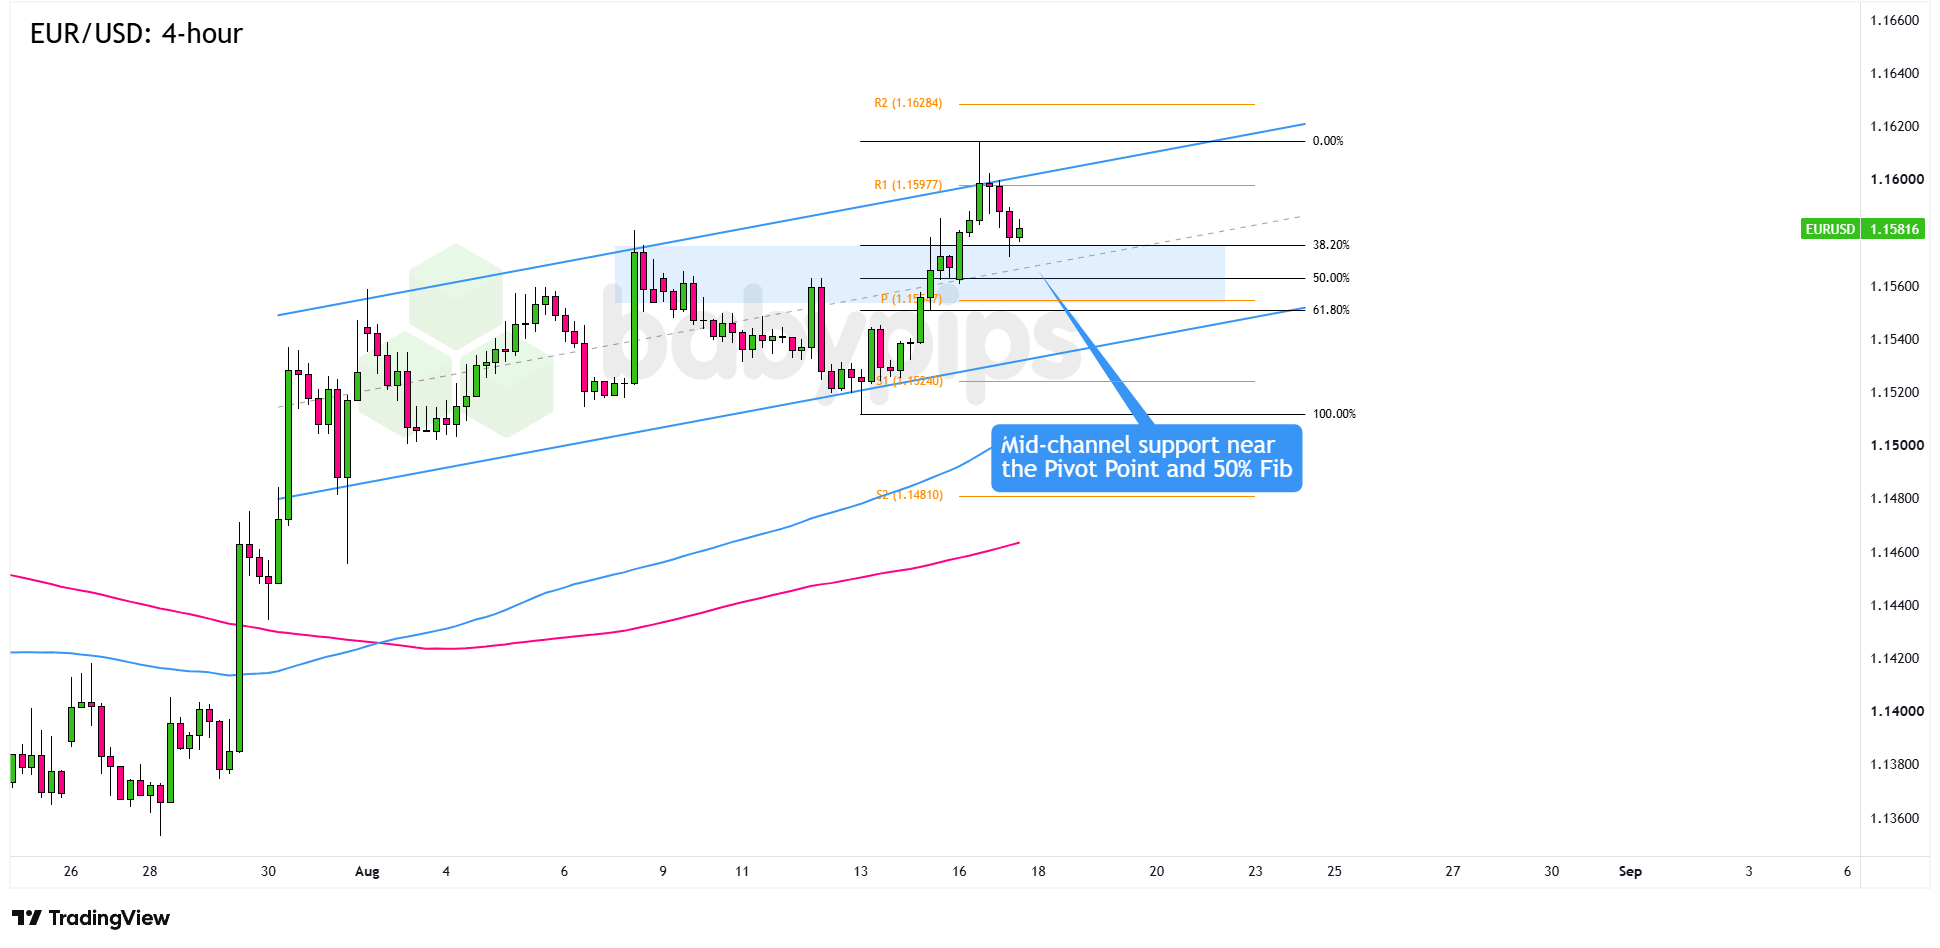
EUR/USD has been trading inside an ascending channel pattern since the start of the month, but has recently pulled back from its latest run at the 1.1600 psychological level.Remember that directional biases and volatility conditions in market price are typically driven by fundamentals. If you haven’t yet done your homework on the euro and the U.S. dollar, then it’s time to check out the economic calendar and stay updated on daily fundamental news!
Price is now hovering just above 1.1560, where the mid-channel line, 50% Fibonacci retracement, and weekly Pivot Point form a tight support cluster.
If buyers defend 1.1560, the first upside target is the R1 Pivot Point at 1.1598, which lines up with last week’s highs near 1.1600. A clean break above that area could put R2 at 1.1628 in play, followed by fresh August highs beyond the channel’s upper boundary.
But if EUR/USD closes convincingly below 1.1560, attention could shift to the 61.8% Fibonacci retracement and lower channel levels near 1.1540.
A break below that support zone would bring the S1 Pivot Point at 1.1524 into focus as the next meaningful floor.
Whichever bias you end up trading, don’t forget to practice proper risk management and stay aware of top-tier catalysts that could influence overall market sentiment!
This EUR/USD setup hinges on a support cluster where the midchannel line, 50% Fibonacci retracement, and weekly Pivot Point all converge at the same price. If assessing overlapping technical signals is new to you, Premium members can read our lesson:
📖 Confluence: Stacking the Odds in Your Favor
Reading this helps you understand how confluence scoring works, why multiple signals at the same level carry more weight than any single indicator, and how to evaluate the quality of a support cluster before you trade it.
And if you’re not a Premium subscriber yet, now’s a good time to sign up.
With Babypips Premium, you get full access to School of Pipsology lessons that help you understand not just what the chart is showing, but why the levels that matter most are often the ones where several technical factors line up at once.



