


Markets leaned risk-off on Monday as long-dated Treasury yields extended their climb and a fresh flareup in the Middle East pushed oil sharply higher. U.S. stocks slipped for a second straight session even as chipmakers rallied on a report of surging AI-sector sales, while the U.S. dollar recovered from an early slide to finish a touch softer against the majors. Check out the forex news and economic updates you may have missed in the latest trading session!
Check out the forex news and economic updates you may have missed in the latest trading session!
News Headlines & Data:
- New Zealand Services NZ PSI for July 2026: 50.6 (51.4 forecast; 50.6 previous)
- New Zealand Electronic Retail Card Spending for July 2026: 3.4% y/y (0.8% forecast; 1.3% y/y previous)
- Japan GDP Growth Annualized Prel for Q2 2026: 1.1% y/y (1.9% y/y forecast; 1.8% y/y previous)
- Japan Industrial Production Final for June 2026: 4.9% y/y (4.2% forecast; -2.1% y/y previous)
- China Retail Sales for July 2026: 0.6% y/y (1.5% forecast; 1.0% y/y previous)
- China Industrial Production for July 2026: 4.5% y/y (5.0% forecast; 5.3% y/y previous)
- China Unemployment Rate for July 2026: 5.2% (5.1% forecast; 5.0% previous)
-
Canada CPI Growth Rate for July 2026: 3.0% y/y (2.9% forecast; 2.8% y/y previous)
- Canada Core Inflation Rate for July 2026: 2.3% y/y (2.2% forecast; 2.1% y/y previous)
- Canada Foreign Securities Purchases for June 2026: 40.83B (7.9B previous)
- NY Empire State Manufacturing Index for August 2026: 20.6 (12.0 forecast; 15.6 previous)
- NAHB U.S. Housing Market Index for August 2026: 35.0 (34.0 forecast; 34.0 previous)
Broad Market Price Action:
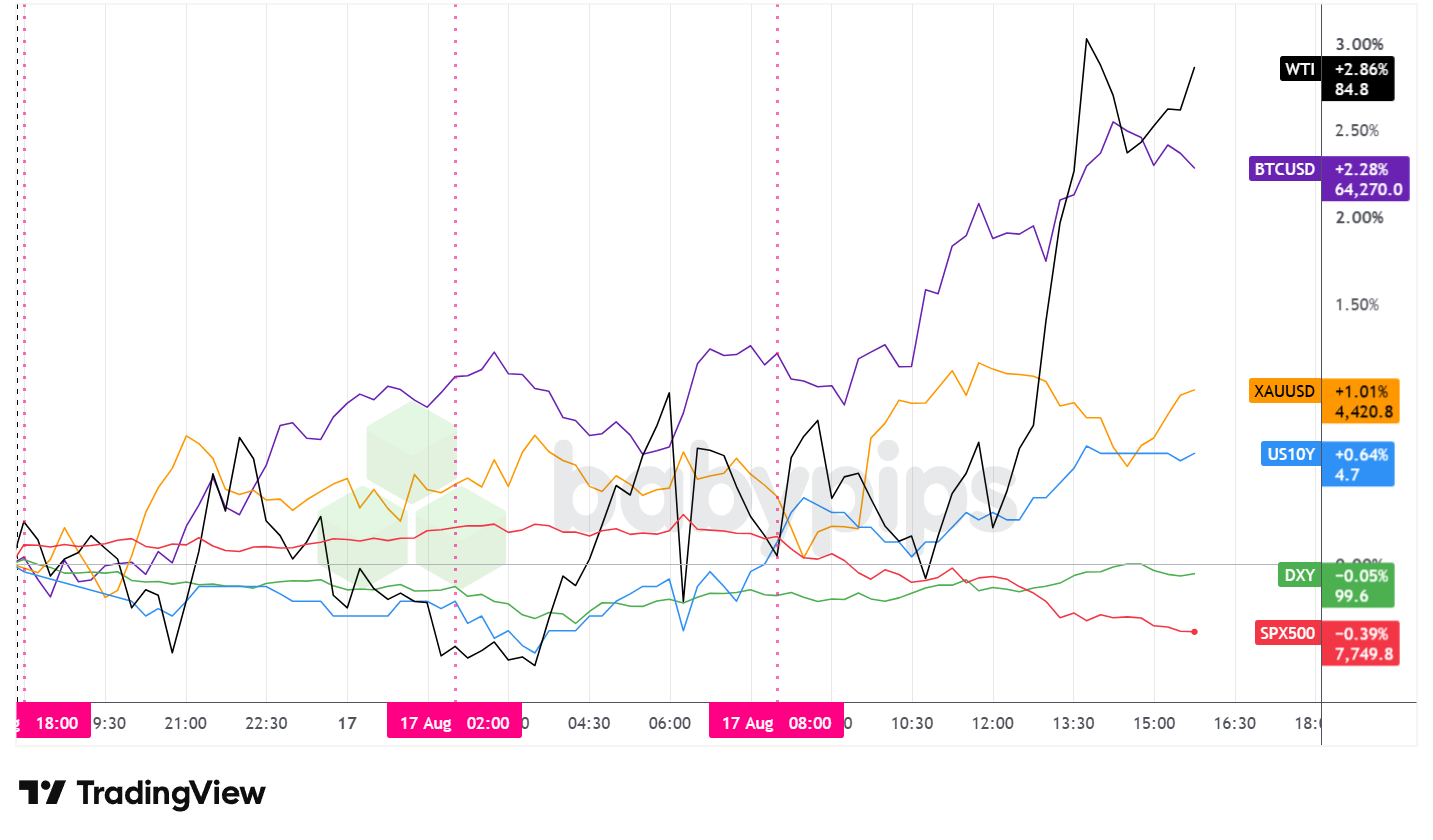
Dollar Index, Gold, Oil, S&P 500, U.S. 10-yr Yield, Bitcoin Overlay – Chart Faster With TradingView
Monday’s session ran on two competing threads: a renewed climb in long-dated Treasury yields and a Middle East oil scare on one side, and a burst of enthusiasm around AI-linked chipmakers on the other. Equities followed the risk-off thread lower, while commodities and crypto pushed higher into the close.
The S&P 500 drifted near 7,796 through the Asian and early London hours, then rolled over from late morning in New York as the oil move and the bond selloff took hold, closing near 7,748, down roughly 0.48% on the day. It marked a second straight session of losses. The decline came even as semiconductor names climbed after a Friday report that Anthropic’s second-quarter revenue jumped at least 14-fold from a year earlier, topping $11.5 billion with positive adjusted operating income. Chipmakers including Intel and Micron gained on the read-through for AI hardware demand, while some megacap names lagged, leaving the tech-heavy Nasdaq 100 to erase an earlier advance.
The main intraday swing came after Iran’s Fars news agency reported that the country had detained a UAE-owned oil tanker near Qeshm Island in the Strait of Hormuz. The headline added a fresh geopolitical risk premium to crude and spilled over into selling across bonds and stocks in the afternoon.
Oil had the standout move. WTI held a narrow range near $82 through the Asian and London sessions, with U.S.-Iran talks still stalled and shipping through Hormuz reduced to a trickle. It then broke sharply higher from midday in New York, running up past $84.90 on the tanker headline before settling near $84.80, up roughly 2.86% on the day. Trump told Americans over the weekend to expect higher gasoline prices, and Iran maintained a hard line on reopening the strait, a backdrop that kept a bid under crude.
Treasury yields extended their recent climb. The U.S. 10-year edged up to around 4.73%, up roughly 0.64% on the day, while the 30-year rose nearly six basis points to about 5.31%, the highest since 2007, as part of a broader global bond selloff that lifted Canadian and German long-end rates as well. The move fits a wider shift in which investors are demanding more compensation to hold long-dated debt against persistent above-target inflation, heavy bond supply, and swelling federal deficits. The oil scare likely added to that pressure by reviving near-term inflation concerns.
Gold firmed alongside the risk-off tone and the fresh geopolitical premium. The metal dipped into the early U.S. session before turning higher and pushing toward last week’s highs, closing near $4,421, up roughly 1.01% on the day. Safe-haven demand tied to the Hormuz headlines and the equity pullback likely offered support, even with yields climbing.
Bitcoin ground higher through the day without an obvious asset-specific catalyst, climbing from near $62,800 in the Asian session to a high above $64,580 in the U.S. afternoon before easing to close near $64,270, up roughly 2.28%. Lacking crypto-specific news, the move may simply reflect the same pockets of risk appetite that lifted oil and gold rather than a broad risk-on tone, given the slide in equities.
Promoted: Scale Your Strategies
As an oil spike and a long-end bond selloff whipsaw traders, navigating this kind of macro backdrop requires more than just a good entry, it requires a partner that has seen it all before.While new firms come and go with the volatility, The5ers (4.7★ rating on 32K+ reviews) has spent the last 10 years perfecting a funding model that works for the trader. It’s why over 1.6 million traders worldwide trust them to provide the capital and scaling needed to turn market analysis into meaningful professional growth.
Learn more about The5ers & available discounts
Disclosure: We may earn a commission from our partners if you sign up through our links, at no extra cost to you.
FX Market Behavior: U.S. Dollar vs. Majors
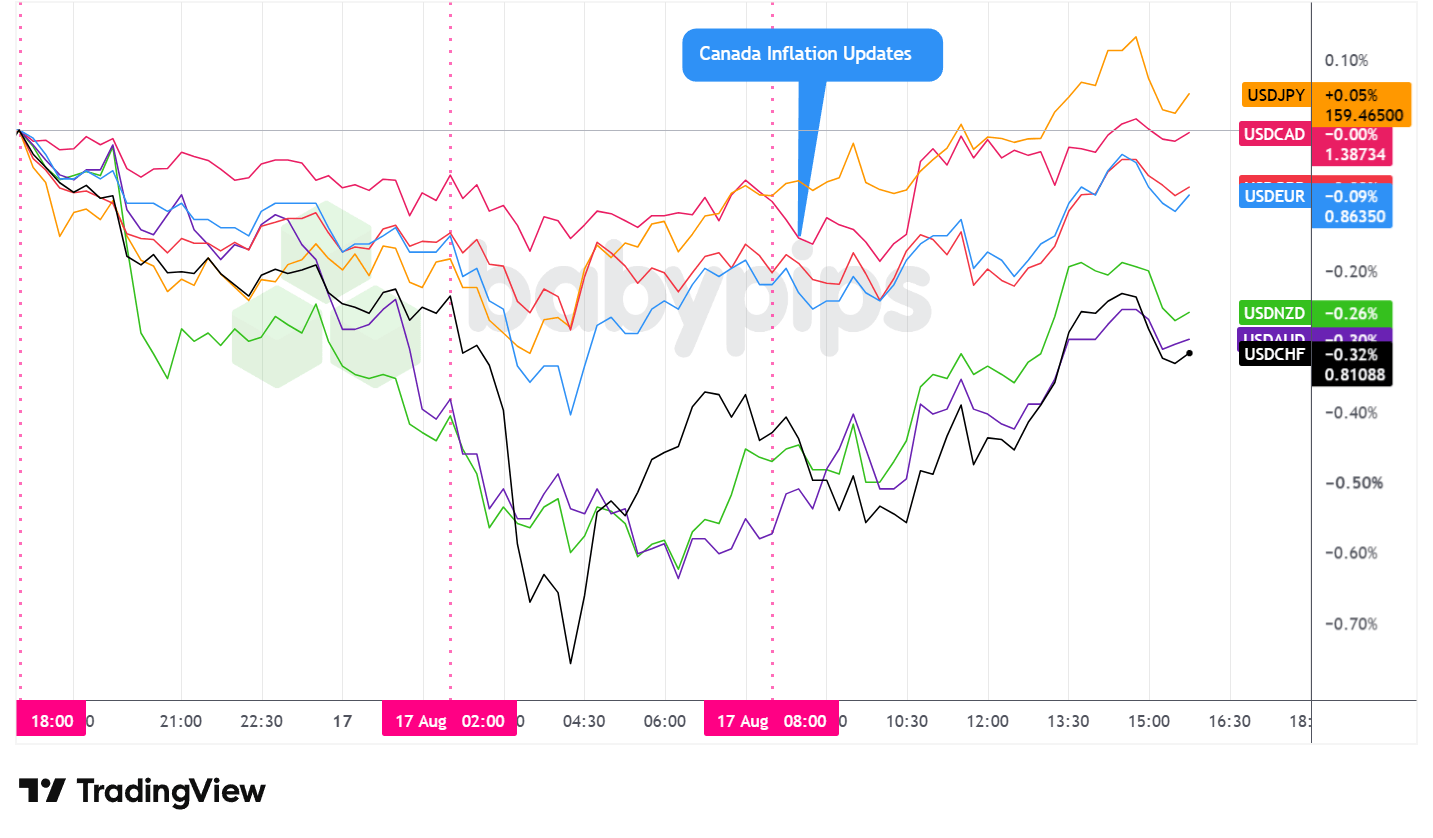
Overlay of USD vs. Major Currencies – Chart Faster With TradingView
The Dollar Index closed little changed, down roughly 0.05% near the 99.58 area, though that flat finish masked a clear intraday arc.
From the Monday Asia open through the early London session, the dollar fell on net against the majors. The greenback softened following last week’s soft U.S. data flow, including Friday’s weak retail sales print, and the move carried into European trade. The yen firmed toward 159 against the dollar for a second straight day even after Japan’s Q2 GDP grew a weaker-than-expected 0.3% quarter on quarter, as traders leaned on fading Fed rate-hike expectations rather than the domestic miss. The Australian dollar pushed to a fresh two-month high in the same window.
By mid-morning in London, the dollar stabilized and slowly rebounded against the majors, a grind that continued through the U.S. open and into the afternoon. The turn lined up with the climb in long-dated Treasury yields and the risk-off shift that followed the Strait of Hormuz tanker headline, both of which appeared to lend the greenback some support into the close.
The Canadian dollar drew its own focus after Canada’s July inflation rate came in at 3.0% year over year, a touch above the 2.9% forecast, with gasoline doing most of the work as the Middle East conflict pushed pump prices higher. Core measures stayed near 2%, so traders looked through the headline, and USD/CAD finished close to flat on the day near 1.3873 as the two countries negotiate ahead of an August 19 tariff deadline.
At Monday’s close, the dollar was a net underperformer against the majors, slipping most against the Swiss franc, Australian dollar, and New Zealand dollar, easing against the euro, and finishing roughly flat versus the Canadian dollar and Japanese yen.
Upcoming Potential Catalysts on the Economic Calendar
- Australia Westpac Consumer Confidence Change for August 2026 at 12:30 am GMT
- U.K. Employment Update for June 2026 at 6:00 am GMT
- ZEW Economic Sentiment Index for August 2026 at 9:00 am GMT
- Euro area ECB Lane Speech at 11:45 am GMT
- Canada Housing Starts for July 2026 at 12:15 pm GMT
- U.S. ADP Employment Change Weekly for August 1, 2026 at 12:15 pm GMT
- U.S. Building Permits Prel for July 2026 at 12:30 pm GMT
- New Zealand Global Dairy Trade Price Index for August 18, 2026
- U.S. Manufacturing & Industrial Production for July 2026 at 1:15 pm GMT
- U.S. Pending Home Sales for July 2026 at 2:00 pm GMT
- U.S. API Crude Oil Stock Change for August 14, 2026 at 8:30 pm GMT
Tuesday’s calendar leans on second-tier data and central bank commentary, which means the Hormuz situation and the long-end bond selloff will likely stay in the driver’s seat for cross-asset direction.
With no top-tier U.S. releases due and Jackson Hole approaching next week, traders may keep one eye on oil headlines and any fresh signal on the Fed path, while the ECB’s Lane and a batch of European sentiment data could add near-term cross currents for the dollar.
Stay frosty out there, forex friends!
Monday’s tanker detention in the Strait of Hormuz sent oil sharply higher and rippled across equities, bonds, and currencies. But most traders don’t realize why a geopolitical event halfway around the world moves their USD pairs. Premium members can read our lesson:
📖 Geopolitical Risk, Trade Policy, and Safe Haven Flows
Reading this helps you understand how geopolitical shocks transmit into currency flows, which safe-haven currencies benefit when the world breaks things, and why risk-off moves in oil and equities show up first in your USD pairs.
And if you’re not a Premium subscriber yet, consider joining to access more lessons like this.
With Babypips Premium, you get full access to School of Pipsology lessons that help you understand not just the headline event, but the mechanism that wires geopolitical risk into your trading account.



