





Gold just took one of its worst beatings in months.
Can the bulls find footing around this key triangle support, or is the floor about to give way?
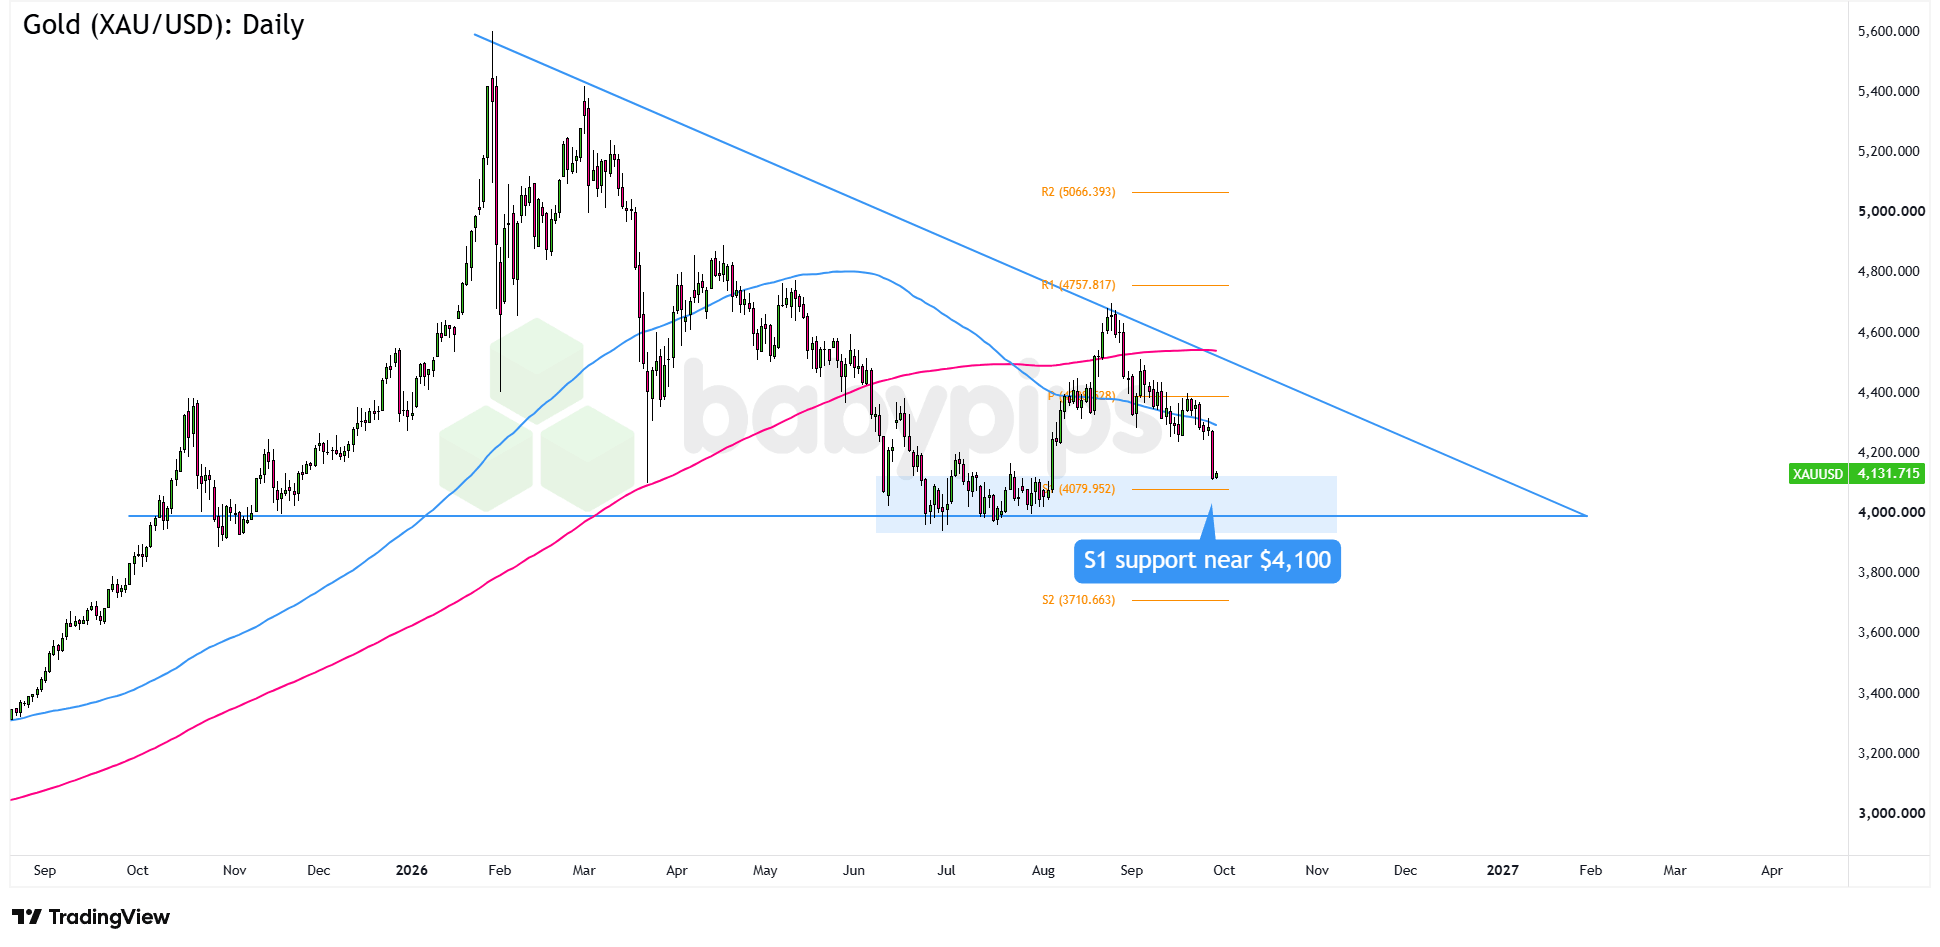
Check out this descending triangle setup on the daily time frame!
Gold (XAU/USD): Daily
Gold (XAU/USD) Daily Chart Faster with TradingView
President Trump’s rejection of Iran’s proposal to reopen the Strait of Hormuz sent Treasury yields soaring to their highest level since 2007 on Monday. That helped strip gold of its safe haven appeal and triggered a selloff of nearly 4%.
XAU/USD tumbled through the $4,200 support zone and is now hovering just above the S1 Pivot Point near $4,100. As you can see, the level also lines up with the bottom of a descending triangle that’s been forming lower highs since mid-September.
Meanwhile, the 100 SMA remains well above the current price and is converging with the descending trend line, adding another layer of resistance to any recovery attempt.
Markets are pricing roughly 70% odds of an October Fed rate hike, and this week’s lineup of Fed speakers, along with Wednesday’s U.S. core PCE report, could keep the pressure on yields.Remember that directional biases and volatility conditions in market price are typically driven by fundamentals. If you haven’t yet done your fundie homework on gold and the U.S. dollar, then it’s time to check out the economic calendar and stay updated on daily fundamental news!
Watch for long red candlesticks to confirm the breakdown. A sustained close below the triangle floor near S1 at $4,079.95 could open the trapdoor toward S2 at $3,710.66, with the $3,800 psychological level along the way.
On the flip side, bullish reversal candles around S1 could signal that gold buyers are stepping back in. A bounce from current levels would bring the Pivot Point at $4,428 and the 100 SMA near the descending trend line back into play. A clean break above the triangle could then put R1 at $4,757.82 on the radar.
Whichever bias you end up trading, don’t forget to practice proper risk management and stay aware of top-tier catalysts that could influence overall market sentiment!
Gold’s current selloff is tied to Fed rate hike expectations and broader U.S. dollar strength, forces that go well beyond the chart pattern on your screen. Premium members can read our lesson:
📖 What Makes Gold’s Price Move?
Reading this helps you understand how interest rate expectations drive gold’s price, why dollar strength and gold often move inversely, and how central bank policy shifts can turn a technical setup like a head and shoulders pattern into a real move.
And if you’re not a Premium subscriber yet, now’s a good time to sign up.
With Babypips Premium, you get full access to School of Pipsology lessons that help you understand not just where support and resistance sit on the chart, but the interest rate and dollar dynamics that decide whether those levels actually hold.



