


Markets were mixed on Tuesday as the unfolding U.S.-Iran peace framework continued to drive crude oil sharply lower and pulled Treasury yields down with it, while a chip-led pullback dragged the S&P 500 into the red even as the Dow notched fresh records.
The Bank of Japan delivered a widely expected hike to a 31-year-high policy rate, though the yen barely reacted, and the Reserve Bank of Australia held steady. The U.S. dollar traded choppy and finished mixed, with an arguably net bearish lean against the majors.
Check out the forex news and economic updates you may have missed in the latest trading session!
Forex News Headlines & Data:
- New Zealand Food Price Index for May 2026: 3.2% (2.7% forecast; 2.6% previous)
- China Retail Sales for May 2026: -0.6% y/y (0.8% y/y forecast; 0.2% y/y previous)
- China Unemployment Rate for May 2026: 5.1% (5.2% forecast; 5.2% previous)
- China Industrial Production for May 2026: 4.5% y/y (4.7% y/y forecast; 4.1% y/y previous)
- Bank of Japan Raises Rates to 1% — Highest Since 1995
- Reserve Bank of Australia held the cash rate at 4.35% as expected; RBA signaled that this was only a pause in hikes for now
- Germany ZEW Economic Sentiment Index for June 2026: 10.5 (-8.0 forecast; -10.2 previous)
- Euro area Labor Cost Index Final for Q1 2026: 3.2% y/y (3.3% y/y forecast; 3.3% y/y previous)
- Euro area ZEW Economic Sentiment Index for June 2026: 9.5 (-6.0 forecast; -9.1 previous)
- Euro area Wage Growth for Q1 2026: 3.4% y/y (2.9% y/y forecast; 3.0% y/y previous)
- U.S. ADP Employment Change Weekly for May 30, 2026: 25.5k (29.0k previous)
- Canada Foreign Securities Purchases for April 2026: 46.91B (4.62B previous)
- Canada Foreign Securities Purchases by Canadians for April 2026: -11.36B (3.9B previous)
- U.S. Export Prices for May 2026: 11.2% y/y (10.4% y/y forecast; 8.8% y/y previous)
- U.S. Import Prices for May 2026: 6.7% y/y (6.0% y/y forecast; 4.2% y/y previous)
- U.S. Housing Starts for May 2026: -15.4% m/m (-2.0% m/m forecast; -2.8% m/m previous)
- U.S. Building Permits Prel for May 2026: -0.7% m/m (-0.6% m/m forecast; 4.4% m/m previous)
- U.S. NY Fed Services Activity Index for June 2026: -10.1 (-5.8 previous)
- New Zealand Global Dairy Trade Price Index for June 16, 2026: -2.8% (-0.6% previous)
Promoted: Capitalize on Historic Market Shifts with Professional Position Sizing
The Bank of Japan just raised rates to 1%—the highest level since 1995—yet the yen barely flinched. Meanwhile, easing geopolitical tensions are sending crude oil lower and sparking massive rotations in equities. When major fundamental catalysts yield unexpected price action, disciplined traders need the flexibility and liquidity to pivot fast. Don’t let a lack of capital keep you sidelined during these rare macroeconomic shifts.
Alpha Capital Group provides access to simulated funded accounts from $5K to $200K, starting at $40, you can execute your high-conviction setups across forex and commodities with the professional position sizing they deserve. Join 250K+ traders in 180+ countries today!
Learn more about Alpha Capital Group!
Disclosure: We may earn a commission from our partners if you sign up through our links, at no extra cost to you.
Broad Market Price Action:
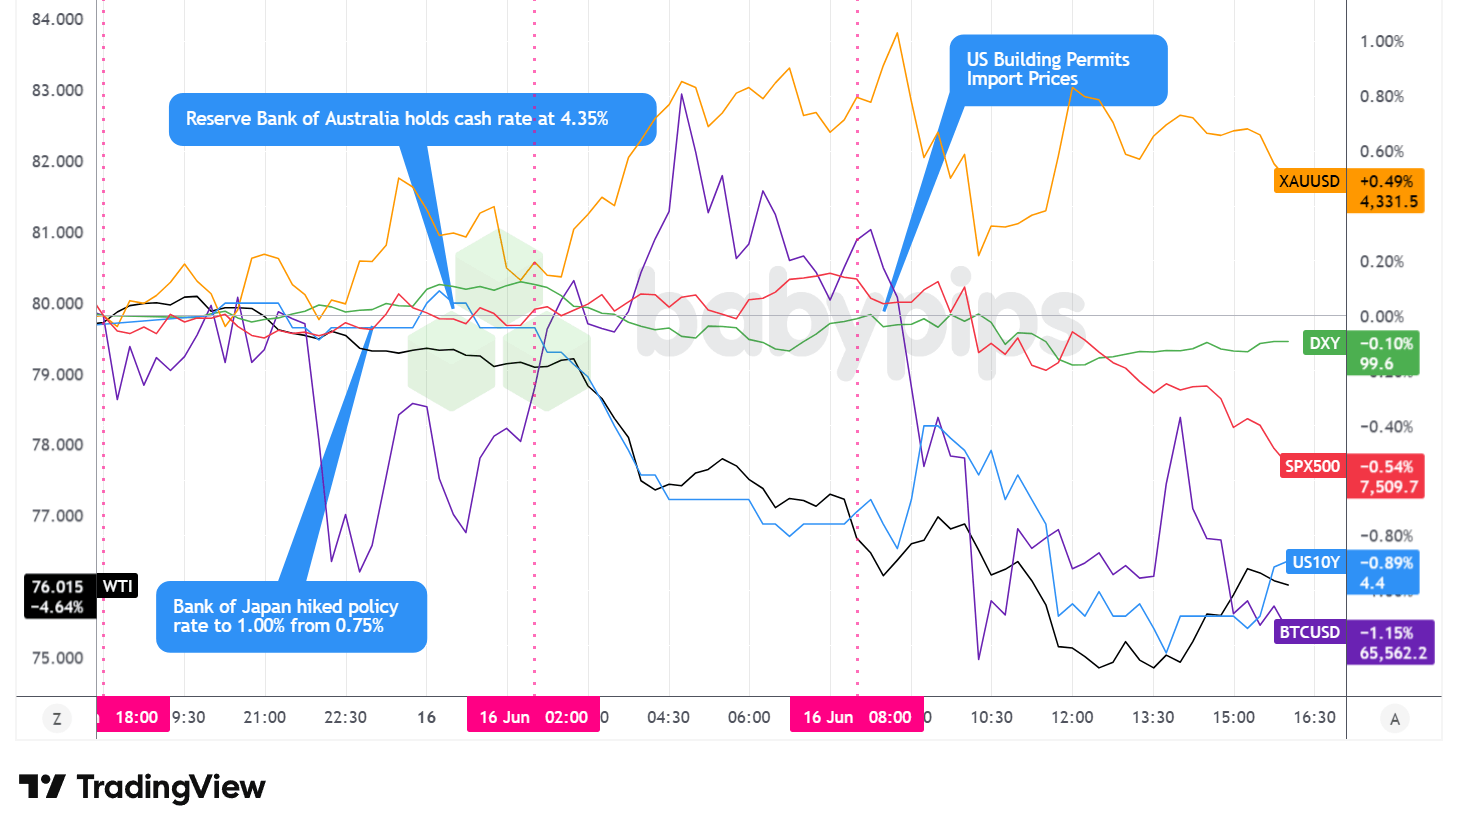
Dollar Index, Gold, Oil, S&P 500, U.S. 10-yr Yield, Bitcoin Overlay – Chart Faster With TradingView
WTI crude oil was the session’s standout mover, tumbling approximately 4.6% to around $76 per barrel. The decline tracked growing optimism around the U.S.-Iran peace framework, with reports that Iranian tankers had begun moving through the Strait of Hormuz after the U.S. lifted its naval blockade, reinforcing expectations for normalizing Gulf supply.
U.S. equities were mixed beneath the surface. The S&P 500 eased roughly 0.5% to around 7,510, likely weighed down by a rotation out of semiconductors that sent the Nasdaq 100 down about 2%, while the Dow Jones Industrial Average pushed to fresh record highs. The split reflected a move into more economically sensitive corners of the market ahead of the first Federal Reserve rate decision under new Chair Kevin Warsh.
Gold edged higher, gaining around 0.5% to roughly $4,331. The metal climbed through the Asian and early London hours to an intraday peak near $4,355 before drifting back and trading choppily through the U.S. afternoon. With no single clean catalyst, the advance possibly reflected support from a softer dollar and easing Treasury yields.
Bitcoin drifted lower, falling around 1.2% to roughly $65,560. The cryptocurrency trended down through the U.S. session after an earlier overnight push toward $66,900. With no obvious direct catalyst, the weakness may reflect broad caution in speculative assets, possibly echoing the chip-led pullback in tech.
The U.S. 10-year Treasury yield eased to around 4.43%, down roughly 4 to 5 basis points on the day. The move lower likely tracked the slide in oil prices, which tempered near-term inflation expectations, with positioning ahead of the Fed decision adding to the bid for bonds.
Promoted: Profitable Trading Isn’t Reserved for Wall Street.
Most traders quietly wonder if consistent profitability is actually achievable for someone like them—or if it’s just a story people tell. Jack Schwager’s newest book, “Market Wizards: The Next Generation,” answers that question directly. The legendary author behind the original Market Wizards series interviews a new generation of successful traders—many self-taught—who built real wealth and income through the markets. Their common thread isn’t genius or insider access. It’s a deliberate process, disciplined risk management, and the conviction to take trading seriously as a pursuit worth mastering.
If that sounds like something worth exploring, this is a good place to start.
Get Market Wizards: The Next Generation on Amazon!
Disclosure: We may earn a commission from our partners if you sign up through our links, at no extra cost to you.
FX Market Behavior: U.S. Dollar vs. Majors
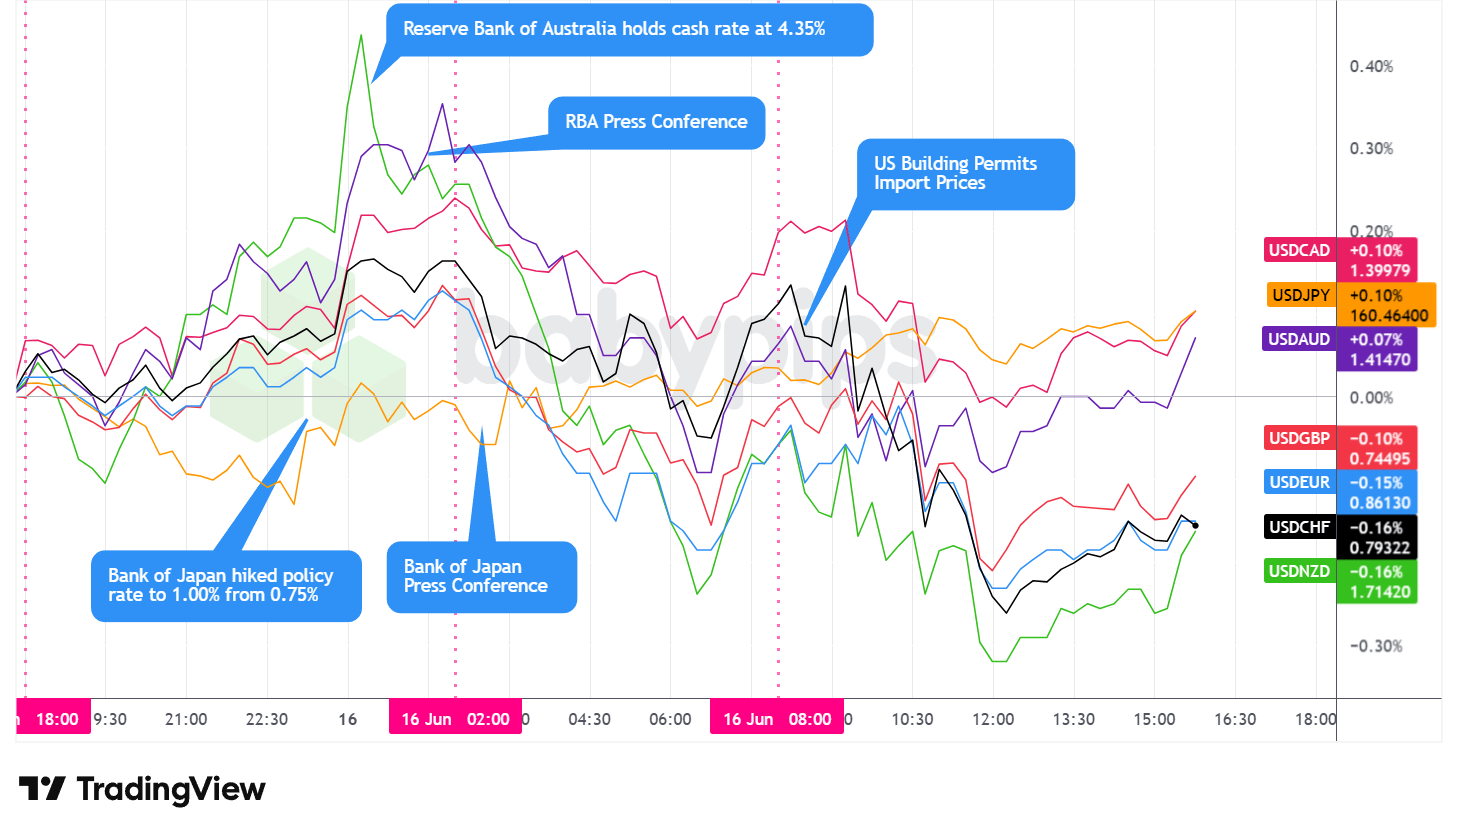
Overlay of USD vs. Majors – Chart Faster With TradingView
The U.S. dollar traded choppy on Tuesday and finished mixed against the majors, with an arguably net bearish lean overall. The dollar index slipped fractionally, finishing little changed near 99.6.
During the Asian session, the dollar traded net higher against the major currencies. The Bank of Japan’s hike to 1.00% drew little currency reaction, with USD/JPY holding above 160.00 since the move had been almost fully priced beforehand. The Reserve Bank of Australia’s hold at 4.35% was equally well anticipated, and the Aussie gave back part of an earlier rally, likely tied to recent peace-deal optimism.
In the morning London session, the dollar fell against the majors before rebounding slightly heading into the U.S. open. Upbeat European data may have lent support to the euro, with German and euro-area ZEW sentiment swinging sharply into positive territory and euro-area Q1 wage growth surprising to the upside at 3.4%.
After the U.S. session opened, the dollar continued to slide, stabilizing in the afternoon and rebounding slightly into the close. U.S. data was mixed, with import prices running hotter than expected while housing starts dropped sharply and the NY Fed services gauge deteriorated.
At the close, the dollar held small gains against the yen, Canadian dollar, and Australian dollar while slipping against the euro, pound, Swiss franc, and New Zealand dollar, leaving it mixed but arguably net bearish for the day.
Promoted: Day traders & Scalpers have better odds of making great decisions if they see market catalysts right away. Get the real-time feed that pros use to catch the news.
Join FinancialJuice for Free to learn more!
Disclosure: We may earn a commission from our partners if you sign up through our links, at no extra cost to you.
Upcoming Potential Catalysts on the Economic Calendar
- New Zealand Westpac Consumer Confidence for June 30, 2026 at 9:00 pm GMT
- Japan Reuters Tankan Index for June 2026 at 11:00 pm GMT
- Japan Machinery Orders for April 2026 at 11:50 pm GMT
- Japan Balance of Trade for May 2026 at 11:50 pm GMT
- Australia Westpac Leading Index for May 2026 at 1:00 am GMT
- Australia RBA Jones Speech at 1:30 am GMT
- U.K. Inflation Updates for May 2026 at 6:00 am GMT
- SECO Swiss Economic Forecasts at 7:00 am GMT
- Euro area CPI Growth Rate Final for May 2026 at 9:00 am GMT
- ECB President Lagarde Speech at 10:50 am GMT
- U.S. MBA 30-Year Mortgage Rate for June 12, 2026 at 11:00 am GMT
- U.S. MBA Mortgage Applications for June 12, 2026 at 11:00 am GMT
- Canada New Housing Price Index for May 2026 at 12:30 pm GMT
- U.S. Retail Sales for May 2026 at 12:30 pm GMT
- U.S. Pending Home Sales for May 2026 at 2:00 pm GMT
- EIA Crude Oil Stocks Change for June 12, 2026 at 2:30 pm GMT
-
FOMC Federal Funds Rate for June 17, 2026 at 6:00 pm GMT
- FOMC U.S. Economic Projections at 6:00 pm GMT
- FOMC Press Conference at 6:30 pm GMT
Wednesday’s calendar is dominated by the Federal Reserve, with the rate decision, updated economic projections, and Chair Warsh’s first press conference all landing in the U.S. afternoon.
Markets widely expect no change to the federal funds rate, so the focus falls on tone: how the Fed frames inflation risk against the recent pullback in oil, any shifts to the dot plot, and whether the projections signal cuts later in the year. U.S. retail sales earlier in the session could add a wrinkle if consumer demand surprises in either direction.
Ahead of the Fed, U.K. inflation data and a speech from ECB President Lagarde headline the European session and could stir sterling and the euro, while final euro-area CPI offers a confirmation read. Overnight, Japan’s Reuters Tankan, machinery orders, and trade balance round out a busy Asian docket following the BOJ’s hike.
Stay frosty out there, forex friends!
Most traders see oil falling and Treasury yields easing, but don’t understand how those moves cascade through equities and affect every currency pair differently. Premium members can read our lesson:
📖 What Is Intermarket Analysis?
Reading this helps you understand how oil prices, bond yields, and equity market rotation move together, why a single geopolitical event can affect multiple asset classes simultaneously, and how those cross-asset correlations shape currency pair movements.
And if you’re not a Premium subscriber yet, consider joining to access the full curriculum.
With Babypips Premium, you get full access to School of Pipsology lessons that help you understand the invisible connections between commodities, bonds, equities, and currencies that move your trading pairs


