


Since we’re seeing stronger moves these days, I’m turning my attention to the longer-term charts of AUD/USD, NZD/USD, and USD/CAD. Don’t forget to watch out for these potential inflection points also!
| AUD/USD | USD/CAD | NZD/USD | |
|---|---|---|---|
| Week Open (WO) | 0.7814 | 1.2617 | 0.6945 |
| Previous Week High (PWH) | 0.7890 | 1.2631 | 0.7210 |
| Previous Week Low (PWL) | 0.7808 | 1.2451 | 0.6953 |
| Top Weekly ATR (tWATR) | 0.7879 | 1.2708 | 0.7019 |
| Bottom Weekly ATR (bWATR) | 0.7750 | 1.2526 | 0.6871 |
| Other significant levels | 0.7930, 0.7735 | 1.2725, 1.2925 | 0.7000, 0.6900 |
In case you’re wondering what ATRs are all about and how I computed those figures, make sure you check out my entry explaining my trading strategies.
Here are some of the comdoll forex setups I’m looking at this week:
AUD/USD: 4-hour
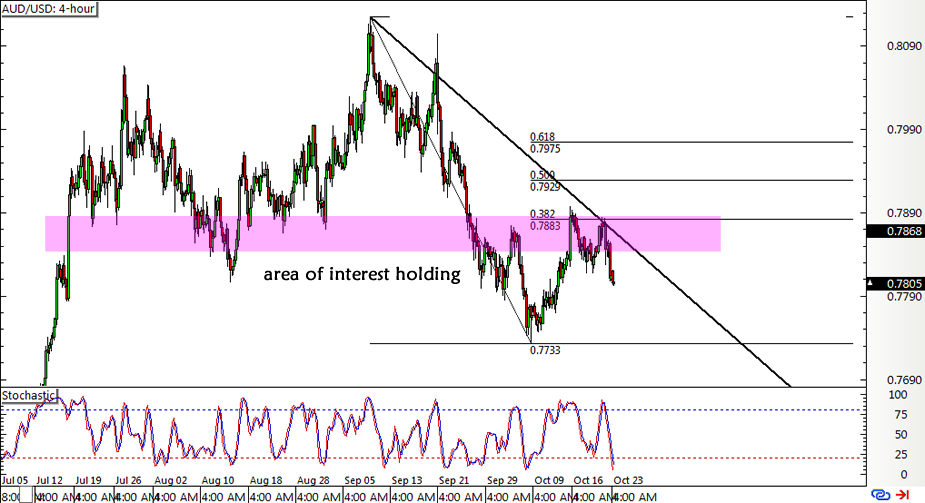
Aussie sellers are getting back in the game after testing an area of interest visible on the 4-hour chart. Price bounced off the 38.2% Fibonacci retracement level and might make its way back to the swing low.
Stochastic is heading lower to show that bearish momentum is present, but the oscillator is approaching oversold levels to signal a potential turnaround. A break past the falling trend line could still lead to a higher pullback to the next Fib levels.
USD/CAD: Daily
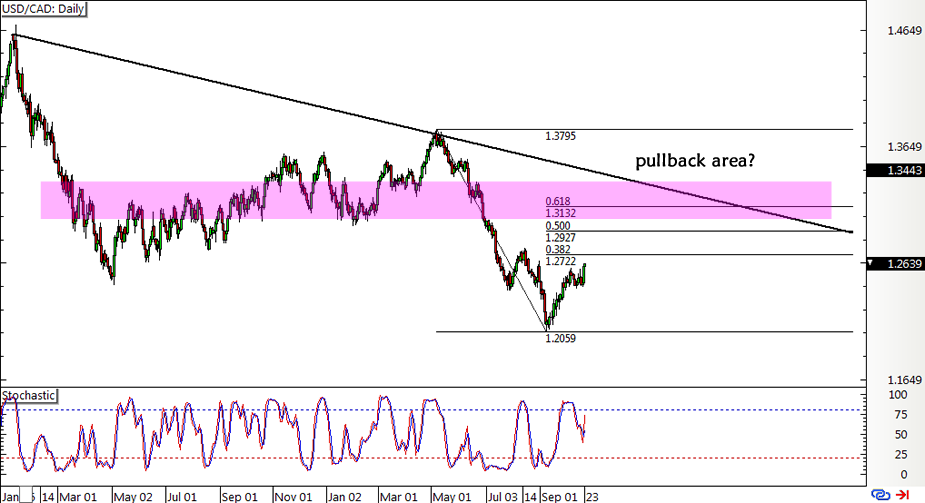
USD/CAD seems to be in the mood for a major correction on its longer-term charts. Applying the Fib tool on the latest swing high and low on the daily time frame shows that price is closing in on the 38.2% level.
But if a higher pullback is in the cards, the pair could make it all the way up to the falling trend line connecting the highs since January last year. This coincides, not just with the 61.8% Fibonacci retracement level, but also an area of interest that served as resistance and support in the past.
NZD/USD: Daily
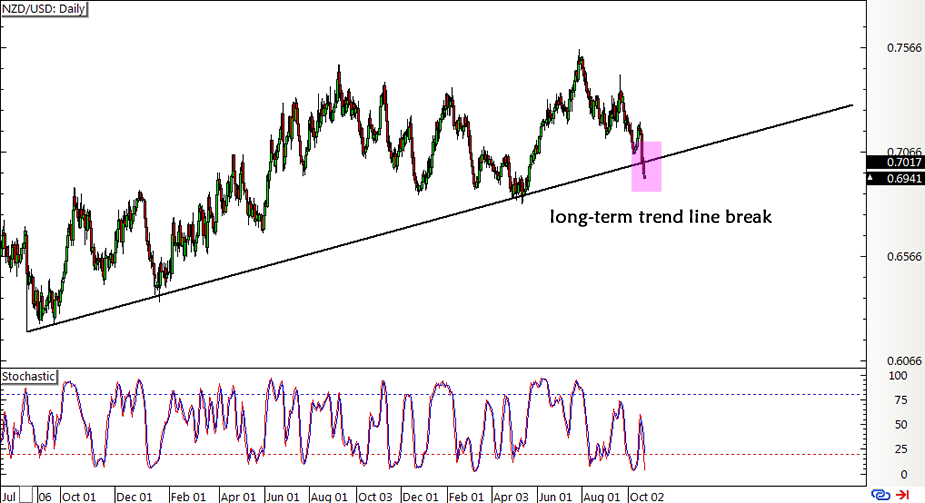
That pullback setup I was watching on NZD/USD last week worked like a charm! Unfortunately I hesitated to hop in at market and chose to wait for a larger correction, so the pair left me sulking behind on its drop.
The selloff was so strong that it took the pair for a test of its long-term rising trend line that had been holding for the past two years. This means that a breakdown would be pretty significant and could be indicative of a longer-term reversal.Stochastic is already dipping into oversold territory on this time frame, though, so there could be room for profit-taking and a quick retest of the broken trend line support.
Cheers,

See also: Q3 2017 Trading Performance Review
This content is strictly for informational purposes only and does not constitute as investment advice. Trading any financial market involves risk. Please read our Risk Disclosure to make sure you understand the risks involved.


