


I’ve got a mix of short-term and long-term charts on AUD/USD, USD/CAD, and NZD/USD this week! Don’t forget to mark these potential inflection points, too.
| AUD/USD | USD/CAD | NZD/USD | |
|---|---|---|---|
| Week Open (WO) | 0.7887 | 1.2475 | 0.7174 |
| Previous Week High (PWH) | 0.7898 | 1.2560 | 0.7197 |
| Previous Week Low (PWL) | 0.7747 | 1.2433 | 0.7056 |
| Top Weekly ATR (tWATR) | 0.7954 | 1.2567 | 0.7242 |
| Bottom Weekly ATR (bWATR) | 0.7819 | 1.2384 | 0.7105 |
| Other significant levels | 0.8125, 0.7725 | 1.2530, 1.2430 | 0.7290, 0.7200 |
In case you’re wondering what ATRs are all about and how I computed those figures, make sure you check out my entry explaining my trading strategies.
Here are some of the comdoll forex setups I’m looking at this week:
AUD/USD: Daily

Down but not out! Aussie bulls are putting up a fight after testing support at the area of interest near the .7700 handle. Not only does this line up with the 50% Fibonacci retracement level, but it also coincides with the middle of the rising channel and a former resistance area.
Stochastic is pulling up to signal that buyers are taking the upper hand from here and may be strong enough to take the pair up to the channel resistance at .8125. On the other hand, a return in bearish pressure could still spur a break of .7700 and a continuation to the channel support.
USD/CAD: 1-hour
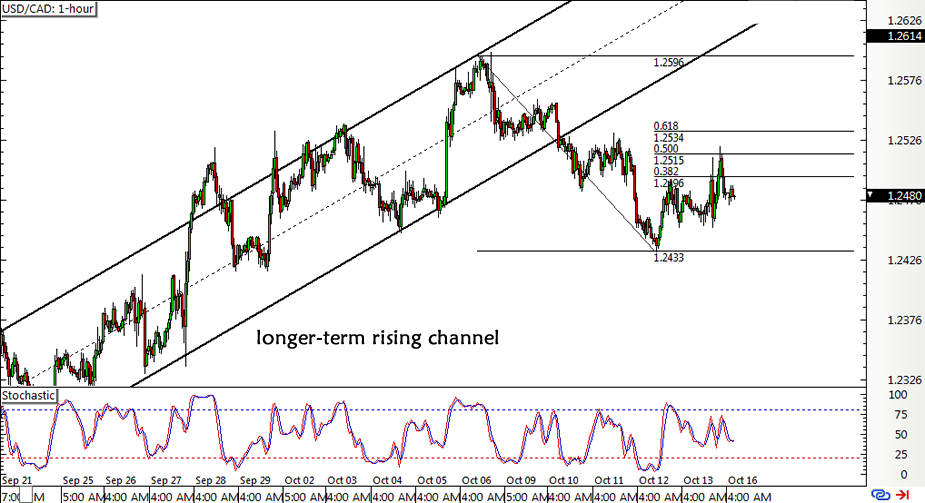
So much for that tight rising channel I was watching on USD/CAD last week! Price slipped through support and dipped to a low of 1.2433 before pulling back up.
Applying the Fibonacci tool on the latest swing high and low shows that the 50% level lines up with the 1.2500 area of interest and appears to be keeping gains in check. If so, USD/CAD could fall back to the swing low to complete a head and shoulders reversal formation, which would be indicative of more losses.
NZD/USD: 4-hour
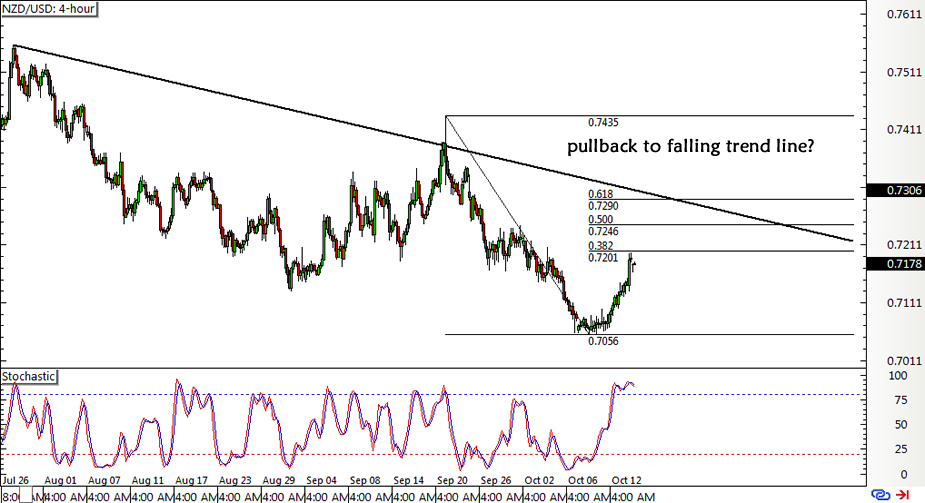
Not so fast! After confirming its long-term head and shoulders selloff signal last week, NZD/USD seems to be waiting for more bears to push it back down.
Price bounced upon hitting the .7050 area and is currently testing the broken support around the .7200 major psychological mark, which lines up with the 38.2% Fib. A higher correction could last until the 61.8% Fib near the .7300 handle, which is right in line with the falling trend line connecting the latest highs.A bit of bearish divergence can already be seen as price is making lower highs while stochastic is at higher highs since mid-September.
Cheers,

See also: Q3 2017 Trading Performance Review
This content is strictly for informational purposes only and does not constitute as investment advice. Trading any financial market involves risk. Please read our Risk Disclosure to make sure you understand the risks involved.


