





Rising Treasury yields pushed USD/JPY to fresh multi-year highs near 160 on Thursday, with a downtrend ceiling right overhead.
Will a Pivot Point resistance stop this rally in its tracks?
Or will 160.00 be back on the table?
USD/JPY: 4-hour
USD/JPY 4-hour Forex Chart Faster With TradingView
In case you missed it, U.S. Treasury yields ended Thursday at their highest levels since 2007, with the 10-year yield finishing near 5.2%. A string of firm economic reports and more hawkish Fed commentary kept the pressure on bonds.
Meanwhile, Japan’s flash PMI showed an 18th straight month of private sector expansion, with price pressures still elevated. The report briefly pulled USD/JPY back toward 157.80 as Japanese government bond futures caught up with the global bond selloff. Yen bulls couldn’t hold the line, though, and USD/JPY climbed back above 158.90 before the close.
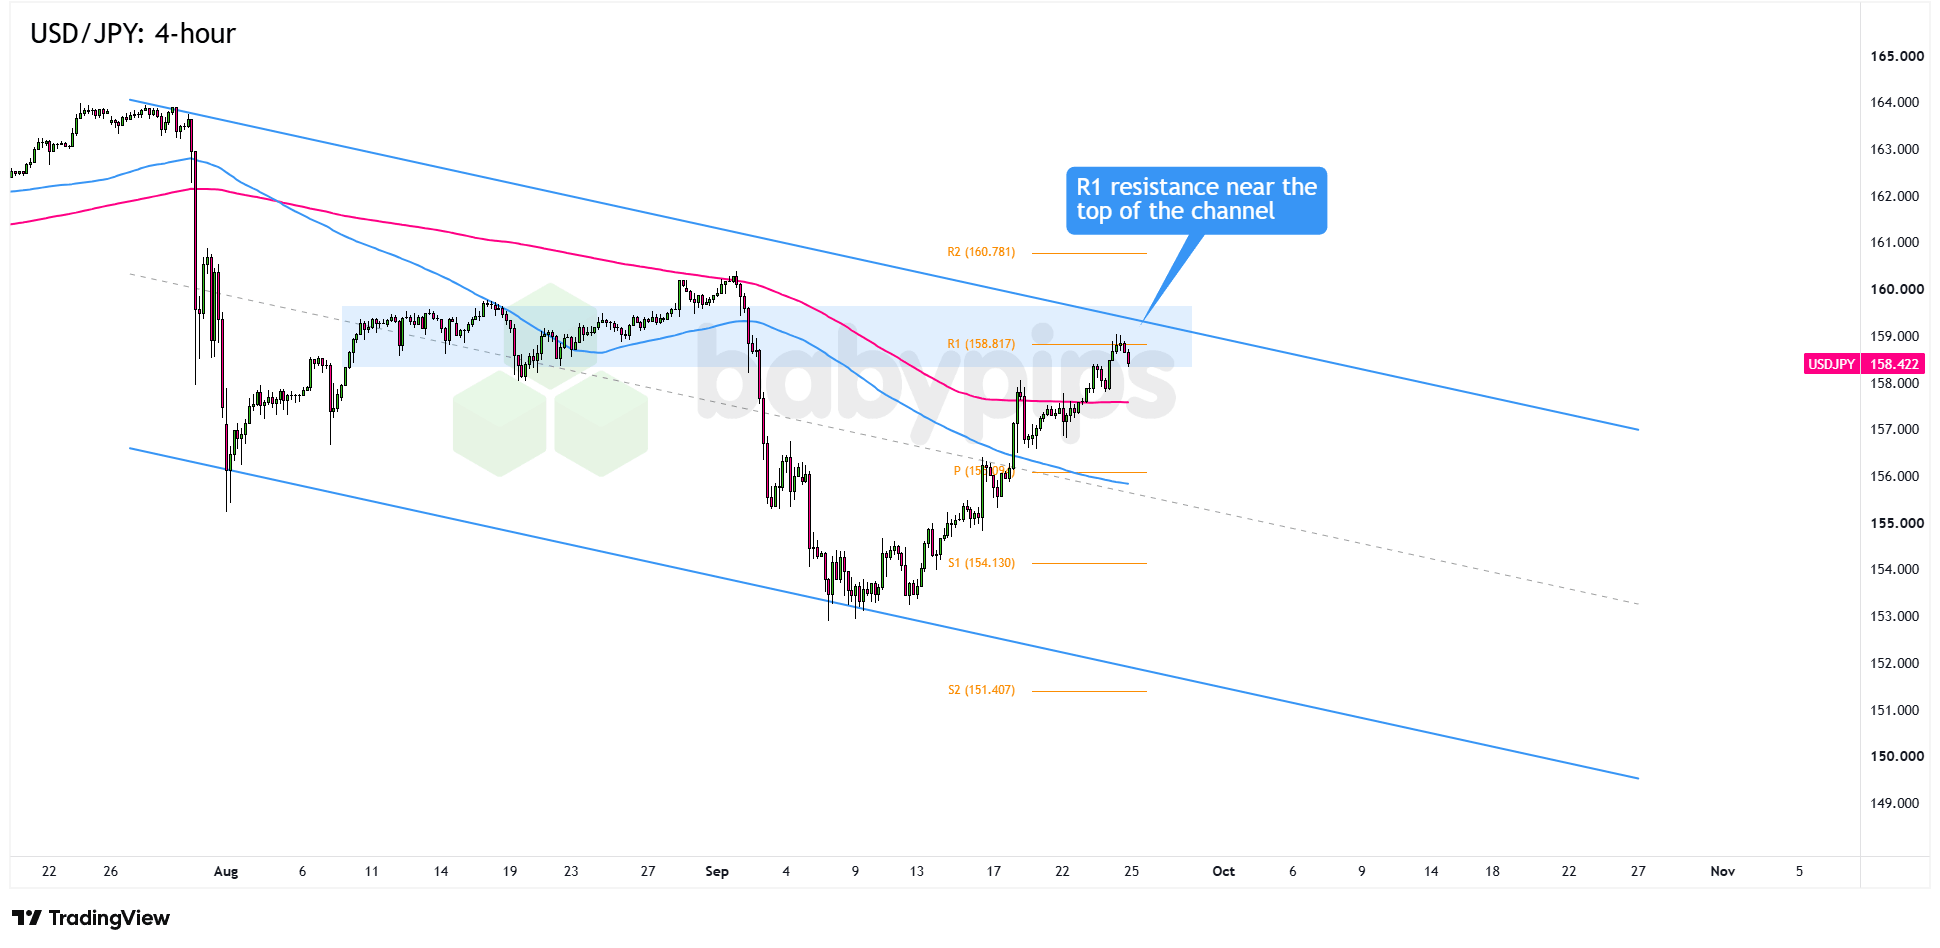
USD/JPY has bounced sharply from its mid-September lows near 153.50 and is now testing R1 at 158.82, which lines up with the top of the descending 4-hour channel pattern.Remember that directional biases and volatility conditions in market price are typically driven by fundamentals. If you haven’t yet done your homework on the U.S. dollar and the Japanese yen, then it’s time to check out the economic calendar and stay updated on daily fundamental news!
If buyers can’t clear R1 and bearish candlesticks begin stacking up near the channel ceiling, the pair could pull back toward the Pivot Point around 156.00. Below that, S1 at 154.13 would be the next major downside level to watch.
On the other hand, if Friday’s durable goods orders, inflation expectations, and lineup of Fed speakers keep Treasury yields elevated, USD/JPY could break above 159.00 and make a run at the 160.00 psychological level near R2 at 160.781.
Whichever bias you end up trading, don’t forget to practice proper risk management and stay aware of top-tier catalysts that could influence overall market sentiment.
Disclaimer:
Please be aware that the technical analysis content provided herein is for informational and educational purposes only. It should not be construed as trading advice or a suggestion of any specific directional bias. Technical analysis is just one aspect of a comprehensive trading strategy. The technical setups discussed are intended to highlight potential areas of interest that other traders may be observing. Ultimately, all trading decisions, risk management strategies, and their resulting outcomes are the sole responsibility of each individual trader. Please trade responsibly.
This USD/JPY setup is being driven by surging U.S. Treasury yields, and if you’re not sure how bond market moves translate into currency price action, that context is worth building. Premium members can read our lesson:
📖 How Bond Yield Spreads Affect Currency Movements
Reading this helps you understand how yield differentials between two countries drive currency trends, why rising U.S. rates relative to Japanese rates put sustained upward pressure on USD/JPY, and how to use spread monitoring as a practical trading signal.
And if you’re not a Premium subscriber yet, now’s a good time to sign up.
With Babypips Premium, you get full access to School of Pipsology lessons that help you understand not just the chart levels, but the bond market forces that explain why USD/JPY is moving in the first place.



