





Is the trend still our friend on NZD/USD?
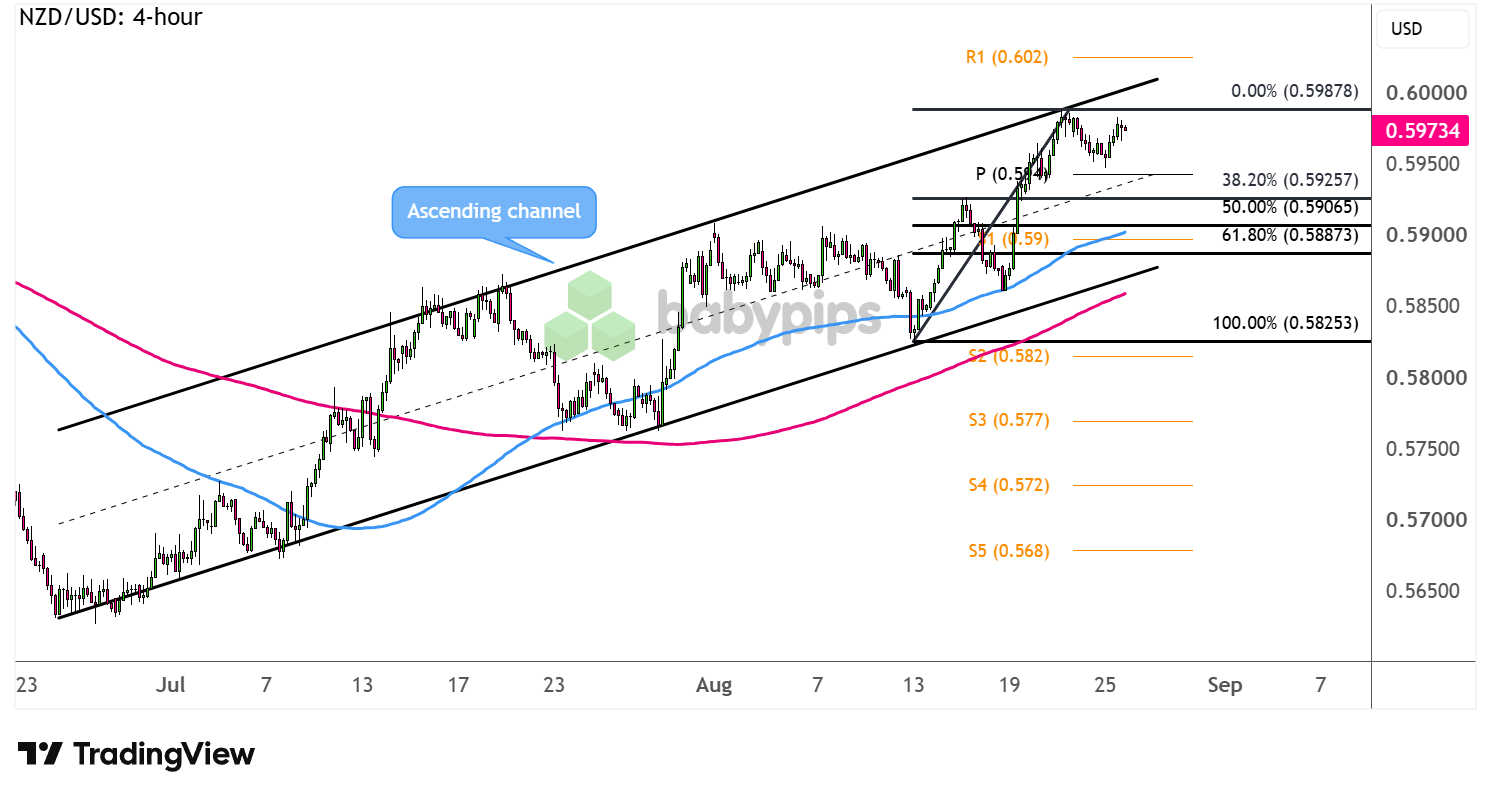
The pair continues to cruise higher inside its ascending channel and looks ready for another pullback.
Check out these retracement levels on the 4-hour time frame:
NZD/USD: 4-hour
NZD/USD 4-hour Forex Chart Faster with TradingView
The Kiwi seems to have shrugged off weaker-than-expected quarterly retail sales data, as market players seem hungry for more risk lately.
To top it off, dollar weakness has been a dominant theme after the U.S. Treasury announced bond buyback operations last week.
Will NZD/USD’s uptrend hold up with this week’s big events?
Dollar traders are looking ahead to the U.S. core PCE report since this is the Fed’s preferred inflation measure. After all, cooling price pressures could weigh on tightening expectations, potentially leading to more USD weakness and risk-taking.Remember that directional biases and volatility conditions in market price are typically driven by fundamentals. If you haven’t yet done your fundie homework on the U.S. dollar and the New Zealand dollar, then it’s time to check out the economic calendar and stay updated on daily fundamental news!
However, the main event is likely to be Fed Chair Warsh’s first Jackson Hole testimony, as his remarks could be the closest thing markets get to having forward guidance.
Look out for dips to the 38.2% Fib around the mid-channel area of interest or the 61.8% level closer to the channel bottom and S1 (.5895), which also happens to be a major psychological support.
Should these levels keep losses in check, NZD/USD could resume the climb to the swing high close to the .6000 major psychological level or the channel top closer to R1 (.6022). On the other hand, a sharp break below the channel bottom and moving averages could point to a possible reversal from the climb.
Whichever bias you end up trading, don’t forget to practice proper risk management and stay aware of top-tier catalysts that could influence overall market sentiment!
This Chart Art piece analyzes a stacked support zone on NZD/USD where the ascending channel support, a Fibonacci retracement, and a pivot point all converge. If the concept of confluence is new to you, Premium members can read our lesson:
📖 Confluence: Stacking the Odds in Your Favor
Reading this helps you understand how multiple technical factors stack at a single price zone, what makes a confluent level carry more weight than a lone support or resistance line, and how to evaluate a setup before you take it.
And if you’re not a Premium subscriber yet, now’s a good time to sign up.
With Babypips Premium, you get full access to School of Pipsology lessons that help you understand not just what the chart is showing, but why zones where Fibonacci levels, pivot points, and broken structure all align carry more analytical weight than any one factor on its own.



