





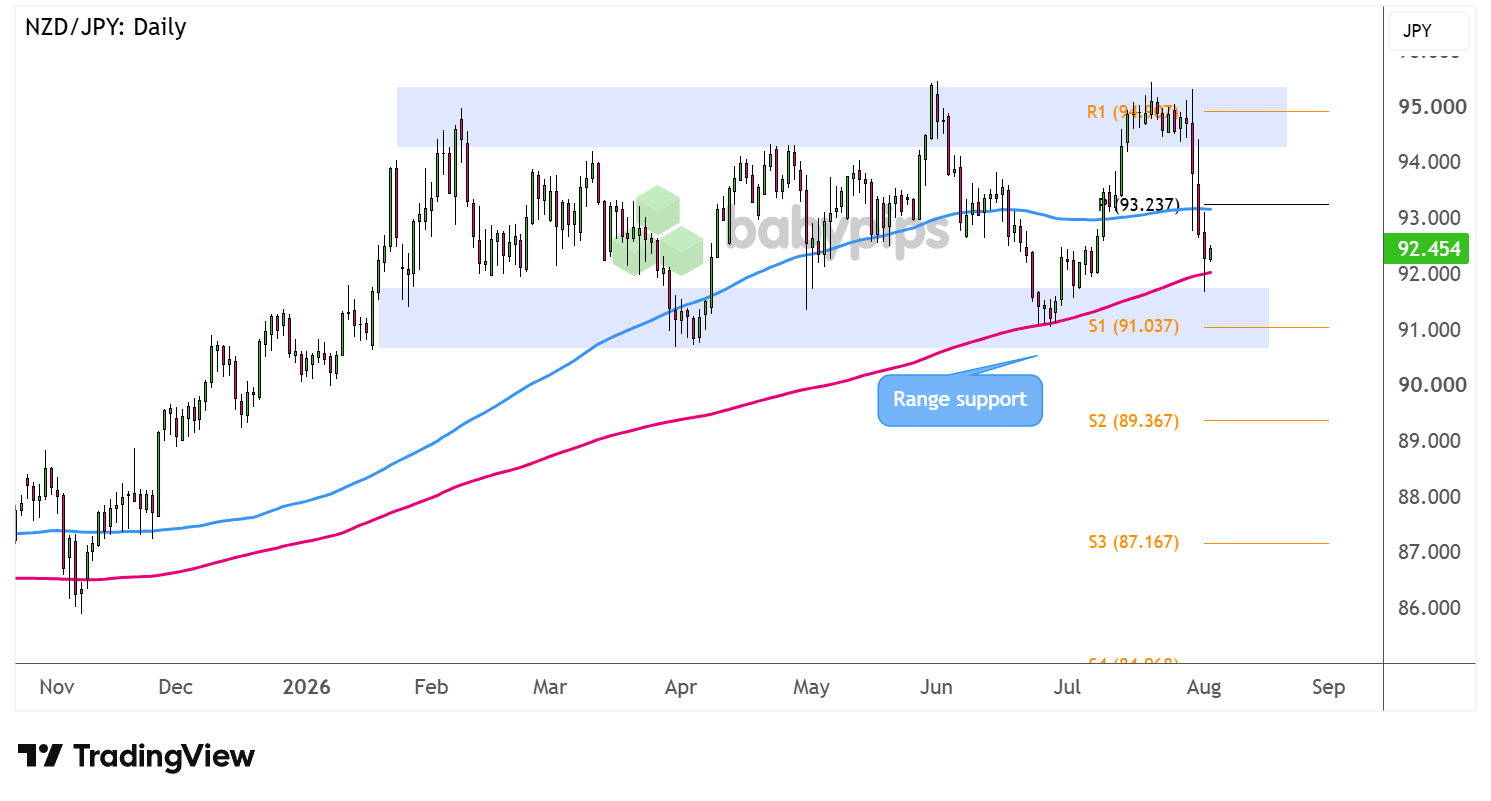
Rumored BOJ intervention sent NZD/JPY tumbling close to the bottom of its long-term range visible on the daily chart.
Will we see a bounce or break from here?
Here are the potential targets in either scenario.
NZD/JPY: Daily
NZD/JPY Daily Forex Chart Faster with TradingView
Last week’s relatively hawkish Bank of Japan (BOJ) decision sent the yen soaring, as Governor Ueda warned that core inflation could keep rising and that they might need to keep raising rates.
Meanwhile, some risk-off flows stemming from resurfacing geopolitical tensions have dragged the higher-yielding Kiwi down.
Does NZD/JPY have enough energy to break below its range support?
NZD/JPY is closing in on the floor near S1 (91.03) and a major psychological level, so Kiwi bulls could still be keen on defending support.Remember that directional biases and volatility conditions in market price are typically driven by fundamentals. If you haven’t yet done your homework on the New Zealand dollar and the Japanese yen, then it’s time to check out the economic calendar and stay updated on daily fundamental news!
If so, the pair could set its sights back on the next resistance levels such as the pivot point (93.23) then the range top near R1 (94.90).
On the other hand, long red candlesticks piercing through the bottom of the range could confirm that selling pressure is still very much in play. In this case, look out for a continuation move of the selloff to the bearish targets at S2 (89.36) then S3 (87.16) close to the November 2026 lows.
Though the 100 SMA is above the 200 SMA for now, the gap between the indicators is narrowing to hint at a potential bearish crossover. At the same time, the pair is testing the 200 SMA dynamic support, so a break below this indicator could serve as additional confirmation that sellers are gaining the upper hand.
Whichever bias you end up trading, don’t forget to practice proper risk management and stay aware of top-tier catalysts that could influence overall market sentiment!
This article maps out pivot points, S1, S2, S3, and R1 levels around NZD/JPY as it tests the bottom of its long-term range, which may be new territory if you haven’t worked with pivot-based level mapping before. Premium members can read our lesson:
📖 Where Breakouts Happen: Mapping the Key Levels
Reading this helps you understand how to identify and rank the level types that actually produce meaningful breakouts, why range floors and pivot points carry more weight than arbitrary price zones, and how to judge whether NZD/JPY is close to a real range break rather than just a wobble at support.
And if you’re not a Premium subscriber yet, now’s a good time to sign up.
With Babypips Premium, you get full access to School of Pipsology lessons that help you understand not just where a pivot point sits on the chart, but which levels genuinely matter when a range like this one is under pressure.



