





GBP/USD is pausing from its slide as it consolidates right on a key support level visible on the daily time frame.
Or is it gearing up for another leg lower?
Check out these potential targets in the event of a bounce or a breakdown!
GBP/USD: Daily
GBP/USD Daily Forex Chart Faster with TradingView
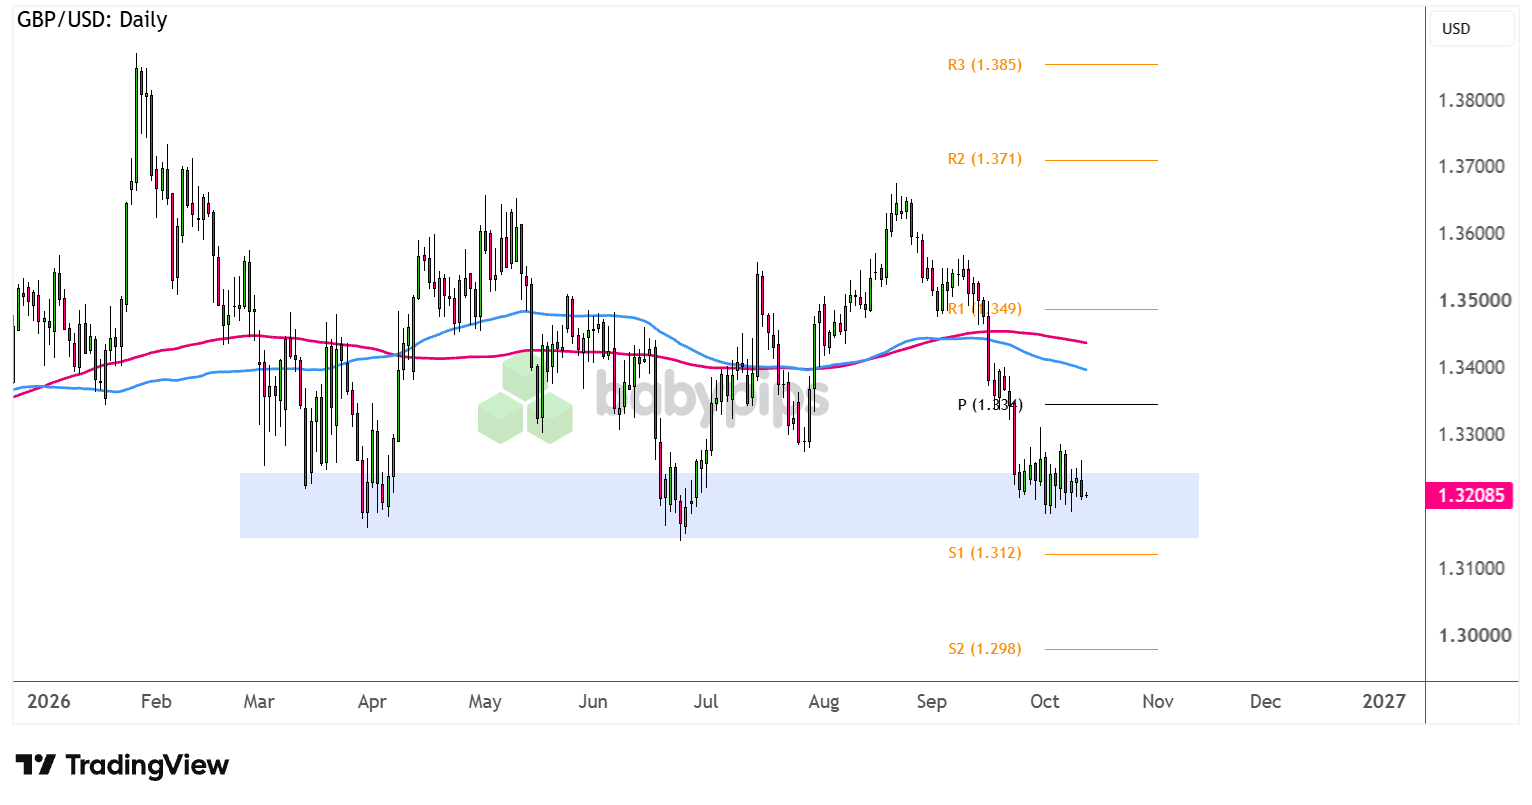
Cable has been moving sideways so far this month, following a steep slide from its August highs around the 1.3650 levels down to the 1.3200 long-term floor.
Fading expectations for an immediate Bank of England (BOE) rate hike, contrasted with strengthening hawkish Fed bets and an actual tightening move, weighed heavily on the pair.
Will bearish pressure pick up again while the U.S. CPI is lined up?
GBP/USD appears to be forming a bearish flag, which is often seen as a continuation pattern. At the same time, the 100 SMA is still below the 200 SMA and is widening the gap to reflect strengthening bearish momentum.Remember that directional biases and volatility conditions in market price are typically driven by fundamentals. If you haven’t yet done your homework on the British pound and the U.S. dollar, then it’s time to check out the economic calendar and stay updated on daily fundamental news!
Stay on the lookout for long red candles confirming a break below the 1.3200 support zone, possibly leading to a test of the next bearish target at S1 (1.3120), then potentially further downside to S2 (1.2980) near the 1.3000 major psychological support.
On the other hand, candles closing above the current consolidation and 1.3300 major psychological resistance could suggest that a bounce is gaining traction. In this case, Cable could set its sights back on the bullish targets at the pivot point (1.3340) then R1 (1.3490).
Whichever bias you end up trading, don’t forget to practice proper risk management and stay aware of top-tier catalysts that could influence overall market sentiment!
GBP/USD is consolidating right on its 1.3200 support zone, but if you’re not sure how to tell whether a candle closing beyond that level signals a real breakdown or just noise, it helps to know what to look for in the candle itself. Premium members can read our lesson:
📖 Reading the Breakout Candle: Conviction vs. Noise
Reading this helps you understand how to read conviction in a breakout candle, which candle traits separate a genuine break of support from a false move, and how to judge whether a close below 1.3200 or above 1.3300 deserves your attention.
And if you’re not a Premium subscriber yet, consider joining.
With Babypips Premium, you get full access to School of Pipsology lessons that help you understand not just where Cable’s support and resistance levels sit, but how to read the price action that confirms a break of them.



