





Cable has been cruising higher over the past couple of months, and it looks like Warsh’s speech created a pullback opportunity.
Will the GBP/USD channel support hold?
Check out these retracement levels on the 4-hour time frame.
GBP/USD: 4-hour
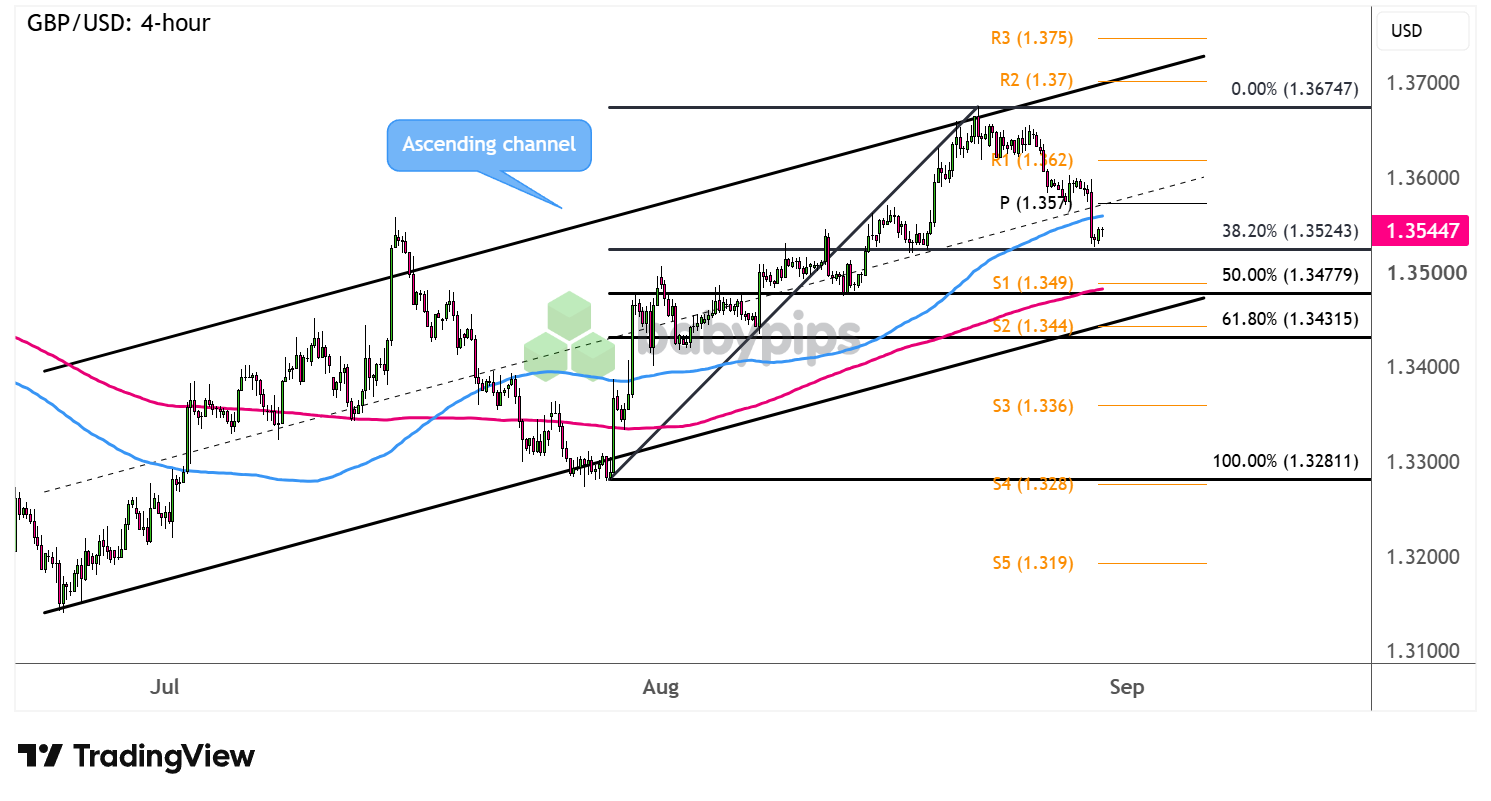
GBP/USD 4-hour Forex Chart Faster with TradingView
A combination of risk-taking and improving U.K. data lifted the pound throughout August while Fed head Warsh’s refusal to give forward guidance put the dollar on the back foot.
However, all that shifted when the Fed head spoke during the Jackson Hole Symposium, as he turned the spotlight on inflation and caused tightening odds to jump.
Can GBP/USD still resume its climb soon?
The pair is closing in on the 38.2% Fibonacci retracement around 1.3525, which may be enough to attract buyers to return. A larger pullback could still test the 50% Fib closer to S1 (1.3490) or the 61.8% level in line with S2 (1.3440) and the channel bottom.Remember that directional biases and volatility conditions in market price are typically driven by fundamentals. If you haven’t yet done your homework on the British pound and the U.S. dollar, then it’s time to check out the economic calendar and stay updated on daily fundamental news!
Look out for reversal candlesticks at these zones, as a bounce could take GBP/USD back up to the bullish targets at R1 (1.1620) then the swing high near the channel top and R2 (1.3700).
On the flip side, long red candles breaking through the channel bottom and Fibs could set off a reversal to the downside targets at S3 (1.3360) then possibly the swing low at S4 (1.3280).
Whichever bias you end up trading, don’t forget to practice proper risk management and stay aware of top-tier catalysts that could influence overall market sentiment!
This article uses Fibonacci retracement levels to map out where GBP/USD’s pullback could find support, but you may not be familiar with how traders decide whether a pullback like this is a temporary retracement or the start of a full reversal. Premium members can read our lesson:
📖 How to Identify Reversals and Retracements
Reading this helps you understand how Fibonacci levels are used to gauge pullback depth, how pivot points and trend lines add extra confirmation, and how to judge whether GBP/USD’s current dip is likely to resume the broader climb or turn into something bigger.
And if you’re not a Premium subscriber yet, now’s a good time to sign up.
With Babypips Premium, you get full access to School of Pipsology lessons that help you understand not just where a Fibonacci level sits on the chart, but how to tell a routine pullback apart from a trend that’s actually turning.



