





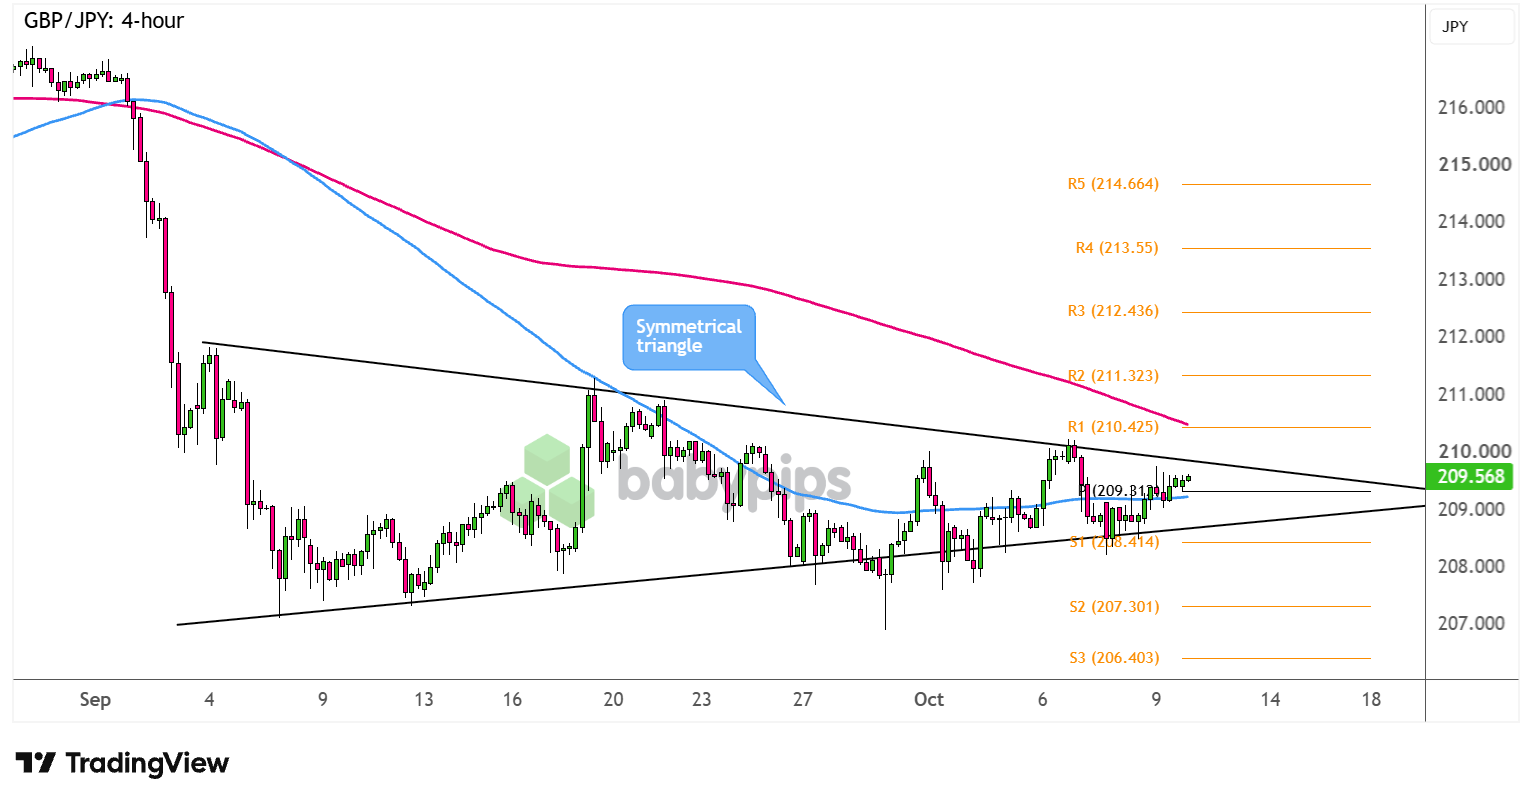
GBP/JPY paused its long-term selloff to consolidate in a symmetrical triangle pattern.
Will we see a breakout or reversal next?
The pair is closing in on its triangle resistance, as well as other key inflection points on the 4-hour chart.
GBP/JPY: 4-hour
GBP/JPY 4-hour Forex Chart Faster with TradingView
Guppy staged a steep selloff in early September, following a rumored intervention by Japanese officials to prop up the yen.
At the same time, not-so-hawkish Bank of England (BOE) expectations contrasted with positioning for a Bank of Japan (BOJ) interest rate hike back then.
Now the pair is stuck in a holding pattern, as price formed higher lows and lower highs inside a symmetrical triangle.
Are we about to see a big break next?
GBP/JPY is inching closer to testing its triangle top as it hovers at the Pivot Point (209.31) near the 210.00 major psychological level.Remember that directional biases and volatility conditions in market price are typically driven by fundamentals. If you haven’t yet done your homework on the British pound and the Japanese yen, then it’s time to check out the economic calendar and stay updated on daily fundamental news!
The 100 SMA is below the 200 SMA for now, suggesting that resistance is more likely to hold than to break.
Should this be the case, look out for another dip to the triangle bottom or perhaps a break below S1 (208.41) that could signal continuation of the earlier downtrend. From there, sellers could set their sights on S2 (207.30), then S3 (206.40) as next potential bearish targets.
On the other hand, long green candlesticks closing above the triangle top could point to a return in bullish momentum. In this scenario, look out for a rally past R1 (210.43) and the 200 SMA, followed by a test of the upside barriers at R2 (211.32), then R3 (212.44).
Whichever bias you end up trading, don’t forget to practice proper risk management and stay aware of top-tier catalysts that could influence overall market sentiment!
GBP/JPY is testing a cluster of chart levels, from its triangle resistance to Pivot Points and the 210.00 psychological mark, but you may not be familiar with how traders decide which of these levels matter most. Premium members can read our lesson:
📖 Where Breakouts Happen: Mapping the Key Levels
Reading this helps you understand which key levels tend to produce meaningful breakouts, how to rank levels like triangle boundaries, pivot points, and psychological marks, and how to map them before price gets there.
And if you’re not a Premium subscriber yet, consider joining.
With Babypips Premium, you get full access to School of Pipsology lessons that help you understand not just where price is sitting on the chart, but which levels are most likely to decide the next move.



