





GBP/CAD has been coiling tighter inside a symmetrical triangle, with bulls and bears still fighting for control.
Price is now sitting on a stacked technical zone that could decide the pair’s next move.
Will buyers use it as a launchpad, or are sellers about to crack the floor?
GBP/CAD: 4-hour
GBP/CAD 4-hour Forex Chart Faster with TradingView
Sterling climbed above $1.36 this week as the dollar softened ahead of Jackson Hole and the U.S. Treasury surprised markets with a bond buying announcement. U.K. inflation accelerated to 2.9% in July, keeping at least 25 basis points of tightening priced in by year-end. The BOE’s rate expectations could support the pound, but a weakening labor market leaves the central bank in a tough spot ahead of its September 17 meeting.
Meanwhile, the Canadian dollar has found its footing as crude oil holds near the mid $80s amid persistent supply risks in the Strait of Hormuz. However, the threat of U.S. tariffs on Canadian exports continues to limit the Loonie’s upside.
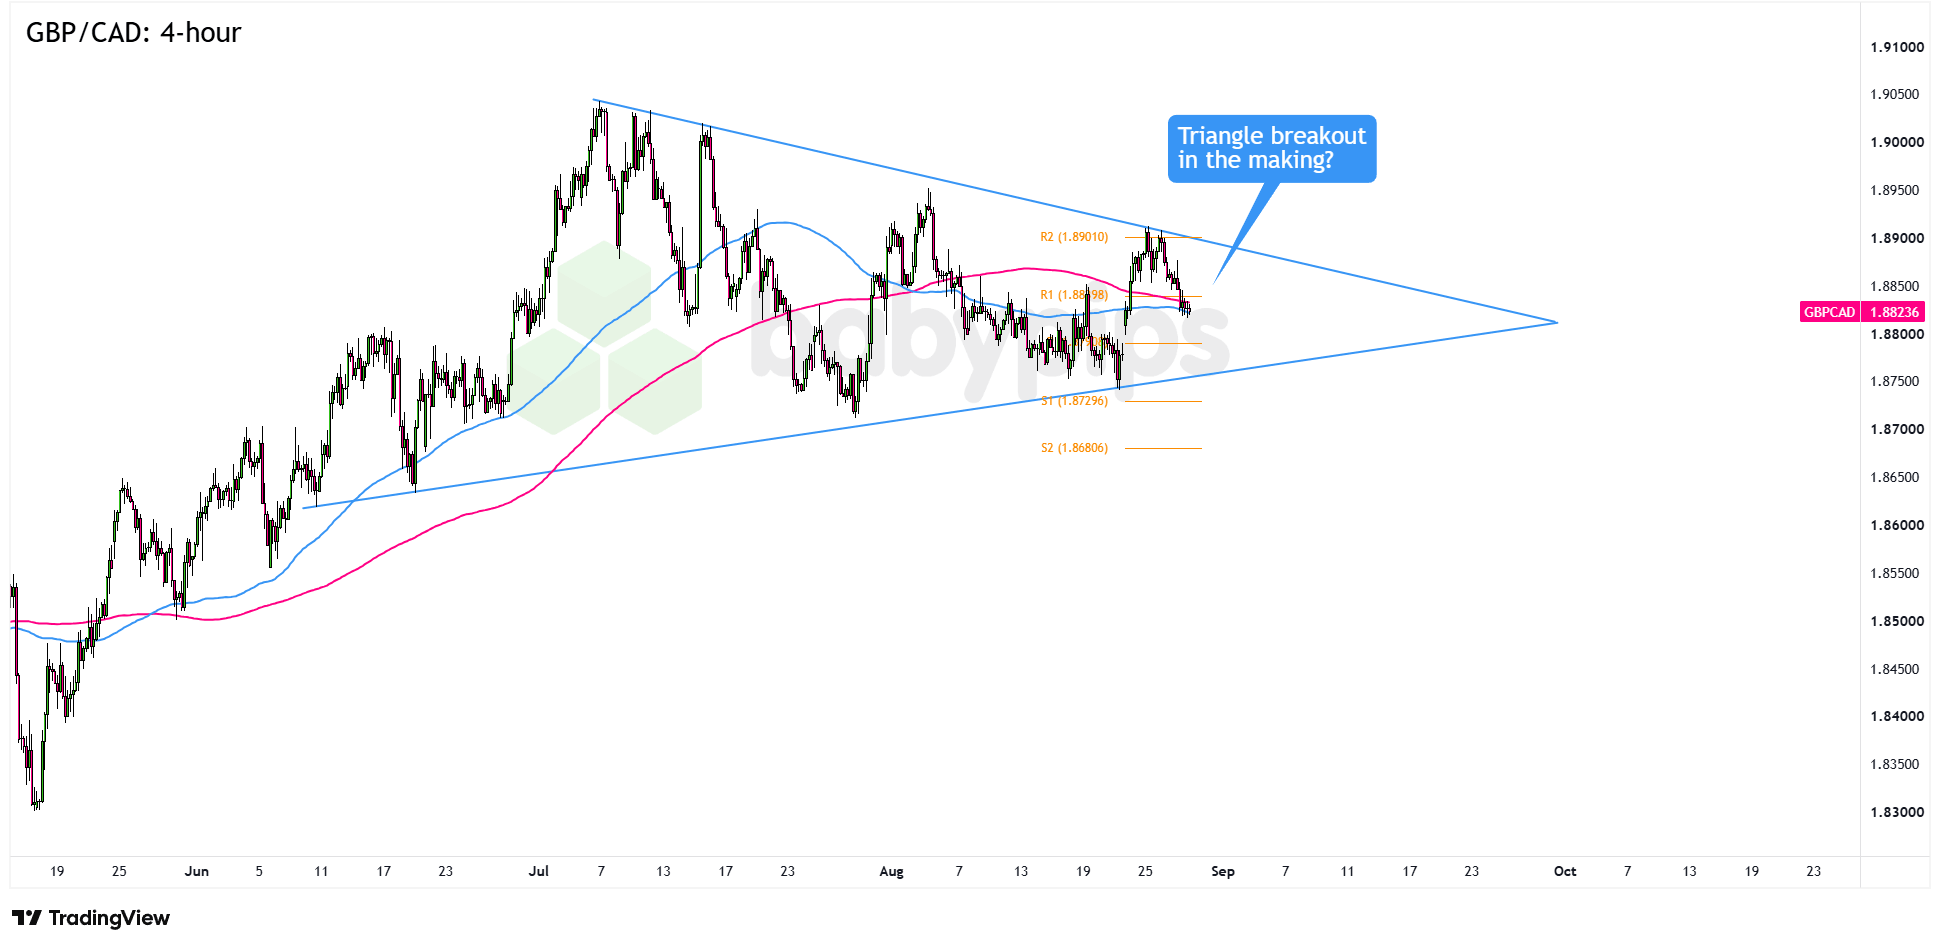
GBP/CAD has been carving out a symmetrical triangle since hitting its July highs near 1.9050, with lower highs and higher lows showing that neither bulls nor bears have taken control.Remember that directional biases and volatility conditions in market price are typically driven by fundamentals. If you haven’t yet done your homework on the British pound and the Canadian dollar, then it’s time to check out the economic calendar and stay updated on daily fundamental news!
What makes the setup interesting today is that the 100 and 200 SMAs are converging right in the belly of the pattern around 1.8820, close to where price is trading. That moving average cluster could provide a dynamic floor, cushioning further pullbacks and keeping a bullish breakout in play as the triangle tightens toward its apex.
Watch for price to hold above the SMA cluster and climb toward the R1 Pivot Point at 1.8830, followed by R2 at 1.8901. A clean break above the falling upper trend line could then open the door to a test of the 1.9000 psychological level.
On the flip side, if sellers overpower the moving averages and drag price below the S1 Pivot Point at 1.8730, the triangle’s rising lower trend line near S2 at 1.8681 would become the next key support area. A sustained break below that zone would shift the near-term outlook firmly in favor of the bears.
Whichever bias you end up trading, don’t forget to practice proper risk management and stay aware of top-tier catalysts that could influence overall market sentiment!
If the symmetrical triangle setup on GBP/CAD and its surrounding key levels are new to you, knowing how to identify the structures that produce meaningful breakouts will help you follow the analysis. Premium members can read our lesson:
📖 Where Breakouts Happen: Mapping the Key Levels
Reading this helps you understand how to identify and rank the specific level types that produce breakouts, what makes a symmetrical triangle a valid breakout candidate, and how to map those levels before price reaches the apex.
And if you’re not a Premium subscriber yet, now’s a good time to sign up.
With Babypips Premium, you get full access to School of Pipsology lessons that help you understand not just the chart pattern in front of you, but the specific levels and structures that make a breakout setup worth watching.



