


EUR/USD has been in selloff mode recently, but could it find buyers at this key support region?
How low could it go in case it breaks down, though?
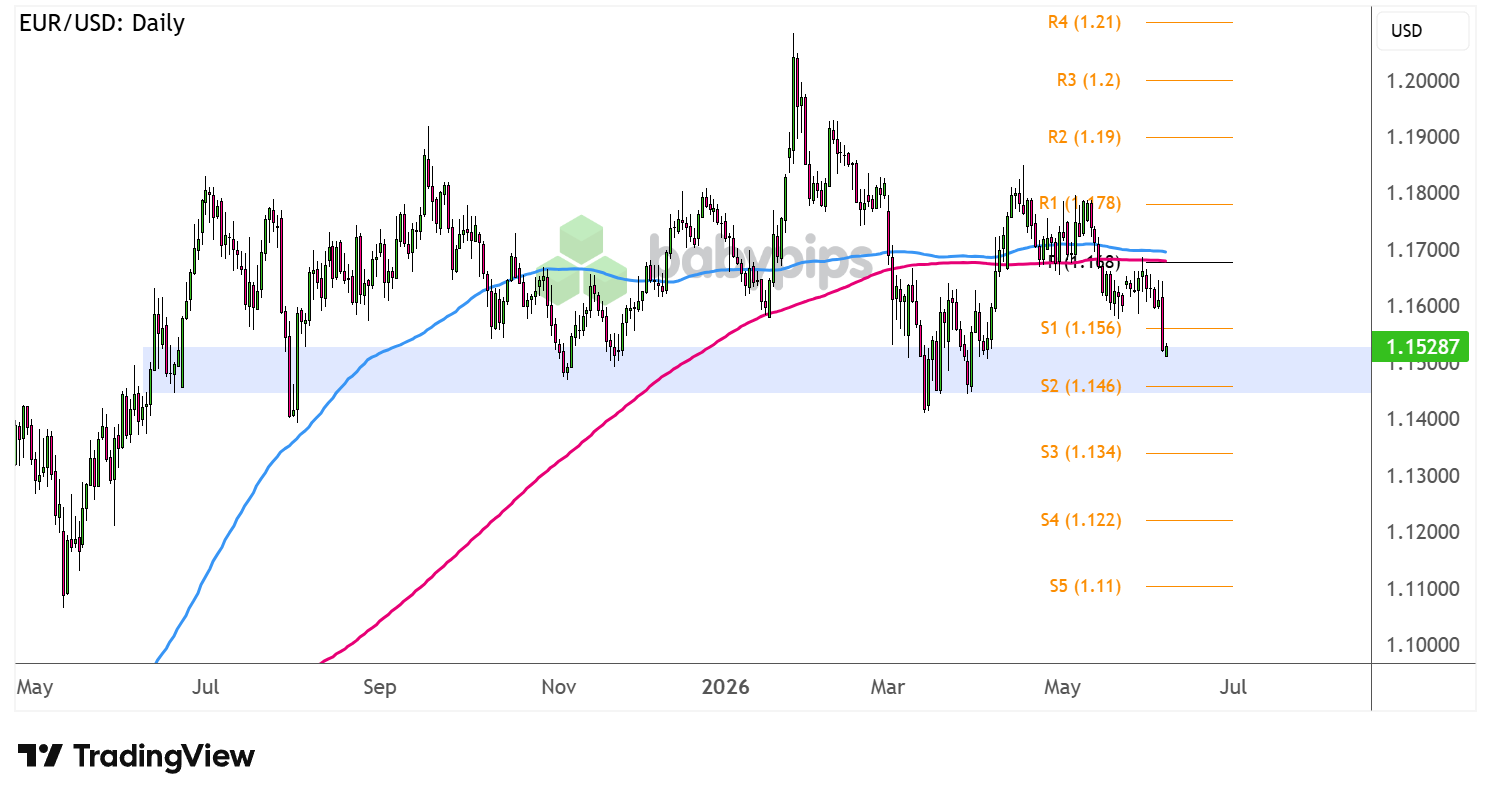
Take a look at these inflection points on the daily chart!
EUR/USD: Daily
EUR/USD Daily Forex Chart Faster with TradingView
A combination of safe-haven flows from escalating geopolitical tensions and strengthening Fed tightening expectations led dollar bulls to charge last week.
EUR/USD fell through the near-term support at the 1.1600 major psychological mark and now seems to be setting its sights on the next potential floor.
Is it due for a bounce from here?
The daily chart shows that EUR/USD is closing in on the 1.1500 major psychological level, which has held as solid support since July last year.Remember that directional biases and volatility conditions in market price are typically driven by fundamentals. If you haven’t yet done your homework on the euro and the U.S. dollar, then it’s time to check out the economic calendar and stay updated on daily fundamental news!
Should buyers continue to defend this level, look out for a potential bounce back to nearby resistance levels, including S1 (1.1560) and the pivot point (1.1680) that already held as a ceiling recently.
A breakdown, on the other hand, could set off an extended slide to the bearish targets at S3 (1.1340) then S4 (1.1220) or all the way down to the May 2025 lows near S5 (1.1100).
Do keep an eye out for a handful of Euro Area mid-tier data, along with the highly-anticipated U.S. CPI release, that could push this pair in a clear direction.
Whichever bias you end up trading, don’t forget to practice proper risk management and stay aware of top-tier catalysts that could influence overall market sentiment!
This article identifies key support levels on EUR/USD and discusses whether price could bounce or break down, and if you’re not sure how to assess the quality of those levels before trading them, Premium members can read our lesson:
📖 Beyond Support and Resistance: Supply and Demand Zones
Reading this helps you understand how to identify high-quality support and demand zones, what separates a level worth trading from one that’s likely to break, and how to grade a zone’s strength before you risk any capital on a bounce.
And if you’re not a Premium subscriber yet, consider joining.
With Babypips Premium, you get full access to School of Pipsology lessons that help you understand not just where the key levels are on a chart, but how to evaluate whether they’re worth trading before price gets there.


