





French budget concerns and higher-than-expected inflation data have teamed up to drag EUR/USD to fresh 2026 lows!
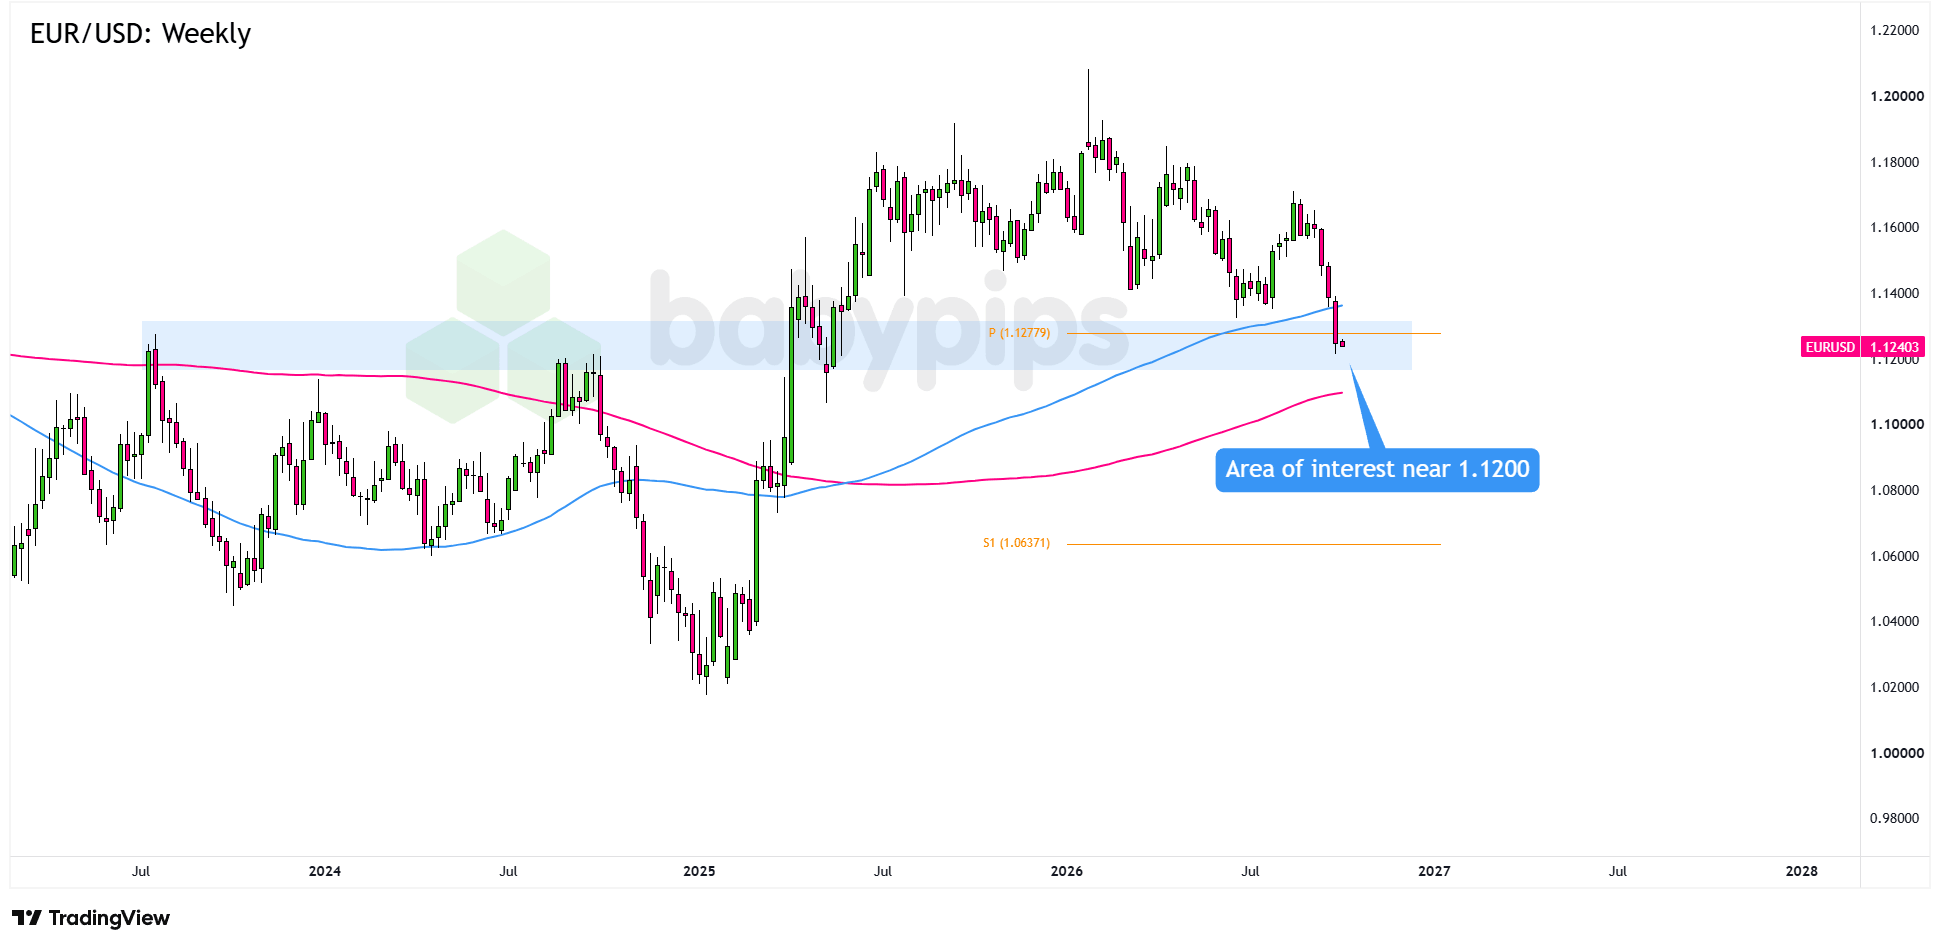
Can the 1.1200 psychological level finally stop the slide?
Let’s take a closer look at EUR/USD’s weekly chart.
EUR/USD: Weekly
EUR/USD Weekly Forex Chart Faster with TradingView
Fiscal worries in France have shaken confidence across the Euro Area, while a string of hot inflation readings has raised fresh concerns about rising bond yields.
The Greenback isn’t sitting still either, as strong U.S. data cools Fed rate cut expectations and keeps Treasury yields elevated.
This combination has pushed EUR/USD through several key technical levels and toward 1.1200, a major long-term reference zone that could shape the pair’s direction for weeks.
If green candlesticks appear and EUR/USD holds above 1.1200, it could signal that buyers are defending the level and open the door to a recovery toward the previous resistance zone near 1.1600.Remember that directional biases and volatility conditions in market price are typically driven by fundamentals. If you haven’t yet done your homework on the euro and the U.S. dollar, then it’s time to check out the economic calendar and stay updated on daily fundamental news!
A stronger rebound could then target the previous highs around 1.1800, followed by the January 2026 spike near 1.2000 for more ambitious bulls.
On the other hand, continued red candlesticks and sustained trading below 1.1200 could send EUR/USD back toward 1.1000.
A deeper selloff, backed by further dollar strength or worsening Euro Area fiscal concerns, could bring 1.0800 into view.
Whichever bias you end up trading, don’t forget to practice proper risk management and stay aware of top-tier catalysts that could influence overall market sentiment!
This EUR/USD chart analysis hinges on what candlesticks do at the 1.1200 level, a setup that requires knowing how to read candles based on where they appear, not just what they look like. Premium members can read our lesson:
Reading this helps you understand why location matters for candlestick signals, how to interpret green and red candles at a key support level, and what candle behavior at the 1.1200 zone actually tells you about who is in control.
And if you’re not a Premium subscriber yet, now’s a good time to sign up.
With Babypips Premium, you get full access to School of Pipsology lessons that help you understand not just what a candlestick looks like, but what it means when it forms at a level that the whole market is watching.



