





Hot Euro Area inflation and weakening Kiwi confidence have pushed EUR/NZD back toward the top of its 2026 range.
With final Euro Area PMIs and several ECB speeches due Thursday, can bulls break above 2.0200, or will resistance keep the pair in check?
Check out these levels on the daily chart!
EUR/NZD: Daily
EUR/NZD Daily Forex Chart Faster with TradingView
Germany’s September CPI rose to 3.3%, its highest level since December 2023, while inflation readings from France and Italy also beat forecasts. Those upside surprises kept expectations for further ECB tightening alive.
Meanwhile, New Zealand’s ANZ Business Confidence index slipped to 51.9 in September, missing the 55.1 forecast and falling from 53.7 in August.
Thursday’s calendar features the final Euro Area Manufacturing PMI, following a flash reading of 52.7, along with speeches from ECB President Christine Lagarde and Executive Board member Isabel Schnabel. Schnabel has already signaled that borrowing costs may need to rise further.
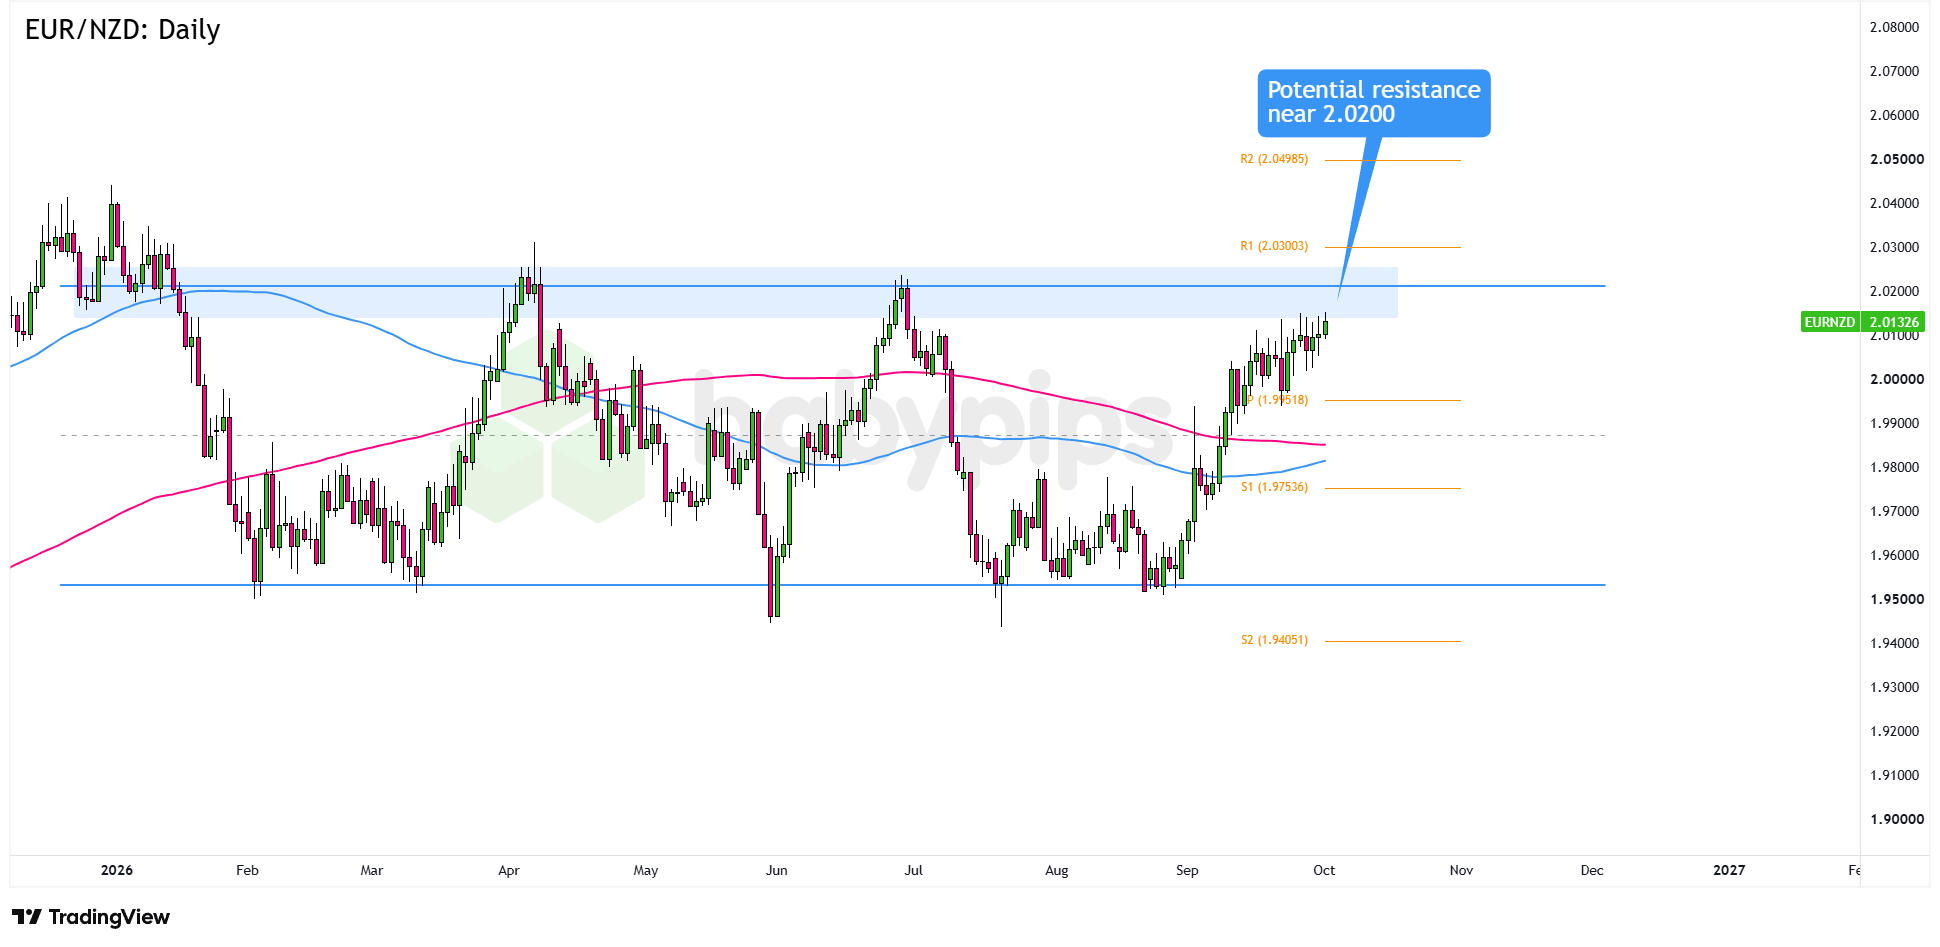
EUR/NZD is pressing against the 2.0200 zone, which has capped the pair several times this year. Another rejection could pull price back toward the monthly Pivot Point and the converging 100 and 200 SMAs near the 1.9900 mid-range area. If selling picks up, S1 near 1.9750 could serve as the next downside target.Remember that directional biases and volatility conditions in market price are typically driven by fundamentals. If you haven’t yet done your homework on the New Zealand dollar and the euro, then it’s time to check out the economic calendar and stay updated on daily fundamental news!
On the flip side, a daily close above 2.0200, supported by stronger PMIs or hawkish comments from Lagarde or Schnabel, could open the door to R1 at 2.0300. Sustained buying pressure could then carry the pair toward R2 near 2.0500.
Whichever bias you end up trading, don’t forget to practice proper risk management and stay aware of top-tier catalysts that could influence overall market sentiment.
Please be aware that the technical analysis content provided herein is for informational and educational purposes only. It should not be construed as trading advice or a suggestion of any specific directional bias. Technical analysis is just one aspect of a comprehensive trading strategy. The technical setups discussed are intended to highlight potential areas of interest that other traders may be observing. Ultimately, all trading decisions, risk management strategies, and their resulting outcomes are the sole responsibility of each individual trader. Please trade responsibly.
EUR/NZD has pushed back to the top of its 2026 trading range, and traders unfamiliar with range dynamics may not know how to interpret price behavior at a ceiling that has held multiple times. Premium members can read our lesson:
📖 What Is a Range-Bound Market?
Reading this helps you understand what characterizes a range-bound market, how range floors and ceilings function as decision zones, and how to frame trade scenarios when price repeatedly tests the same resistance level.
And if you’re not a Premium subscriber yet, now’s a good time to sign up.
With Babypips Premium, you get full access to School of Pipsology lessons that help you understand not just what the chart is showing, but the range dynamics that give those key levels their context.



