





EUR/NZD failed to clear a major resistance zone even after a dovish New Zealand catalyst weighed on the Kiwi.
Could the rejection keep the pair in the lower half of its longer-term range, or are bulls simply regrouping?
Here’s what we’re watching on the 4-hour chart.
EUR/NZD: Daily
EUR/NZD Daily Forex Chart Faster with TradingView
The Reserve Bank of New Zealand just raised its Official Cash Rate by 25 basis points to 2.75%, marking its second straight hike this year. Still, the Kiwi weakened across the board as the RBNZ’s cautious tone on future increases disappointed traders expecting a more aggressive tightening cycle.
With Euro Area services PMI data due Thursday and ECB officials still sounding hawkish as the conflict between the U.S. and Iran keeps oil prices and inflation elevated, the euro may have another reason to keep the pressure on NZD.
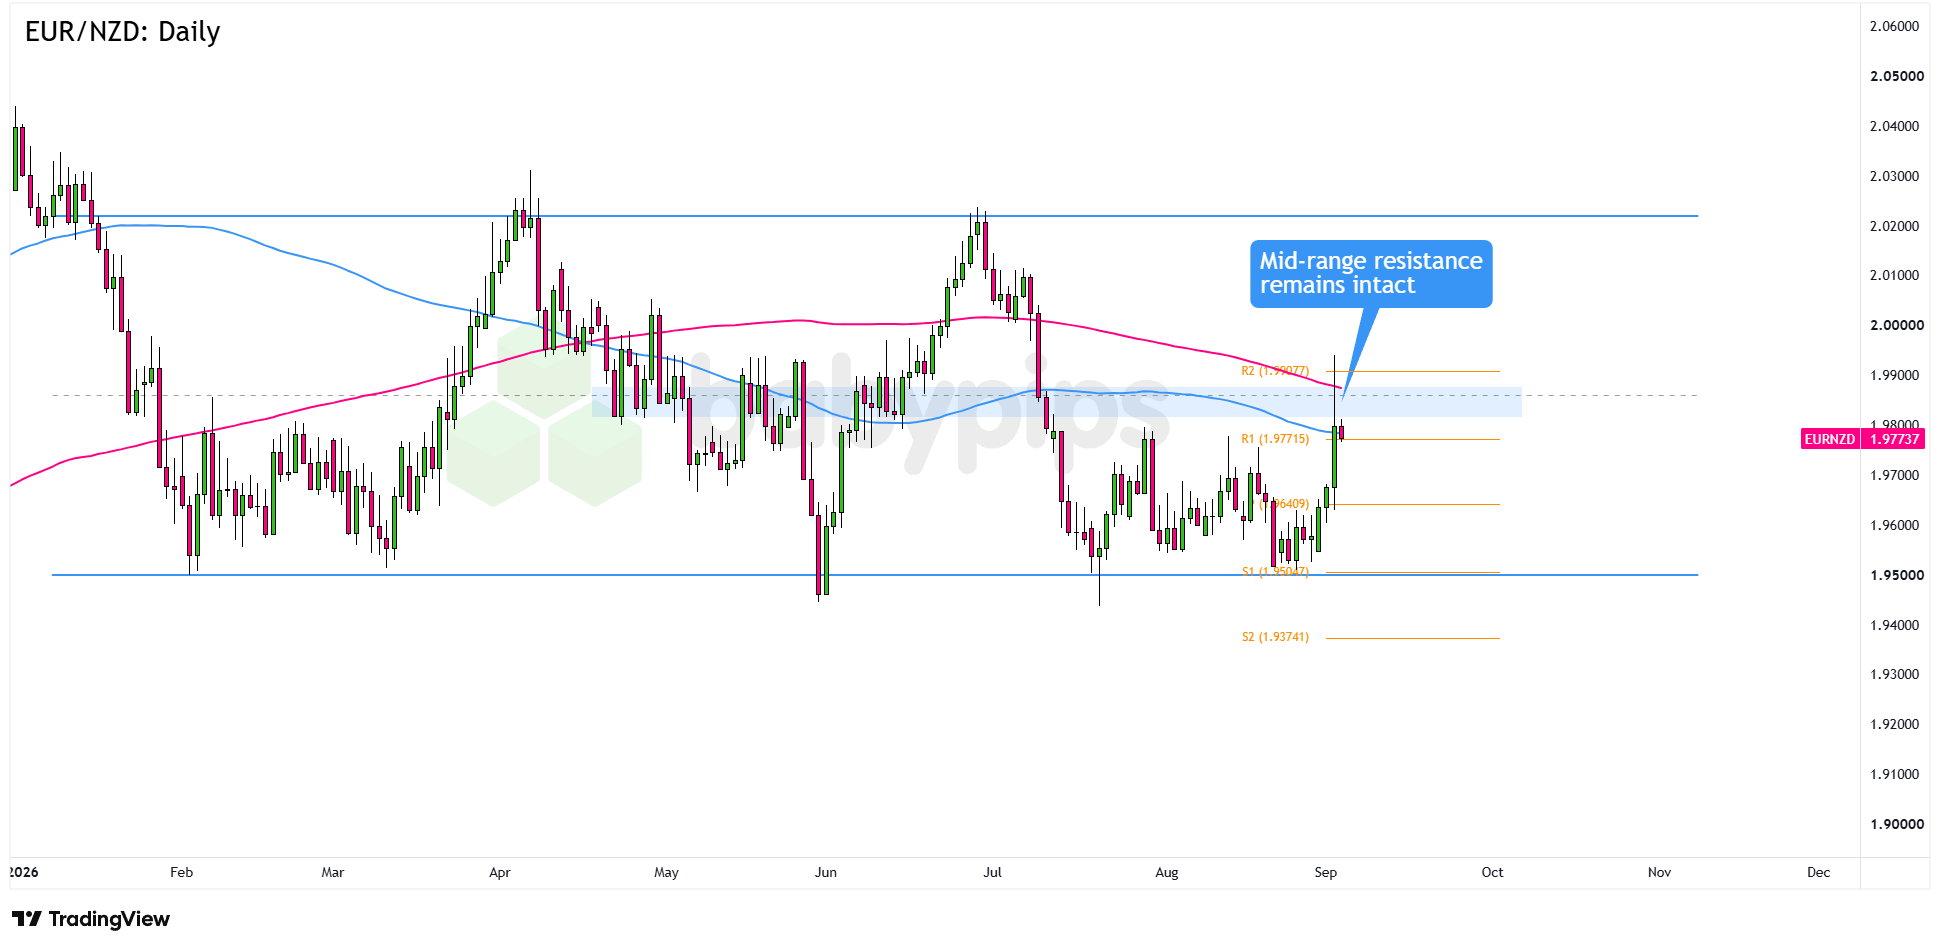
EUR/NZD has spent most of 2026 trading between support near 1.9500 and the July highs around 2.0200. The pair bounced sharply from its mid-August lows near 1.9500 and is now trading around 1.9800, just above the R1 Pivot Point (1.9772).Remember that directional biases and volatility conditions in market price are typically driven by fundamentals. If you haven’t yet done your homework on the New Zealand dollar and the euro, then it’s time to check out the economic calendar and stay updated on daily fundamental news!
That recovery has brought EUR/NZD back into a major resistance cluster formed by the 200 SMA, the R2 Pivot Point (1.9908), and the 2.0000 psychological level. The RBNZ’s cautious guidance has given NZD bears fresh ammunition, but euro bulls may still need a catalyst of their own to break through this crowded area.
Watch for a sustained break and daily close above R2 at 1.9908 and the 2.0000 handle, especially if Thursday’s euro area PMI reports beat expectations and NZD remains weak following the RBNZ’s gradual policy outlook. A confirmed move through this zone could clear the way toward 2.0200, where the July swing highs mark the top of the broader 2026 range.
On the other hand, if buyers lose momentum below resistance and price starts turning lower, the R1 pivot near 1.9772 is the first level to watch. A stronger rejection could drag EUR/NZD toward the S0 pivot around 1.9641, while a full reversal of the recent rally would bring the major 1.9500 support zone back into focus.
Whichever bias you end up trading, don’t forget to practice proper risk management and stay aware of top-tier catalysts that could influence overall market sentiment.
Please be aware that the technical analysis content provided herein is for informational and educational purposes only. It should not be construed as trading advice or a suggestion of any specific directional bias. Technical analysis is just one aspect of a comprehensive trading strategy. The technical setups discussed are intended to highlight potential areas of interest that other traders may be observing. Ultimately, all trading decisions, risk management strategies, and their resulting outcomes are the sole responsibility of each individual trader. Please trade responsibly.
This EUR/NZD setup is built around a two-month consolidation range, and traders new to range analysis may not be familiar with how to read price behavior at range boundaries. Premium members can read our lesson:
📖 What Is a Range-Bound Market?
Reading this helps you understand how to identify a range-bound market, how support and resistance levels function as range floors and ceilings, and how to set up trade scenarios around a consolidation’s key boundaries.
And if you’re not a Premium subscriber yet, consider joining today.
With Babypips Premium, you get full access to School of Pipsology lessons that help you understand not just what the chart is showing, but the range mechanics and key level logic that structure the trade setups.



