





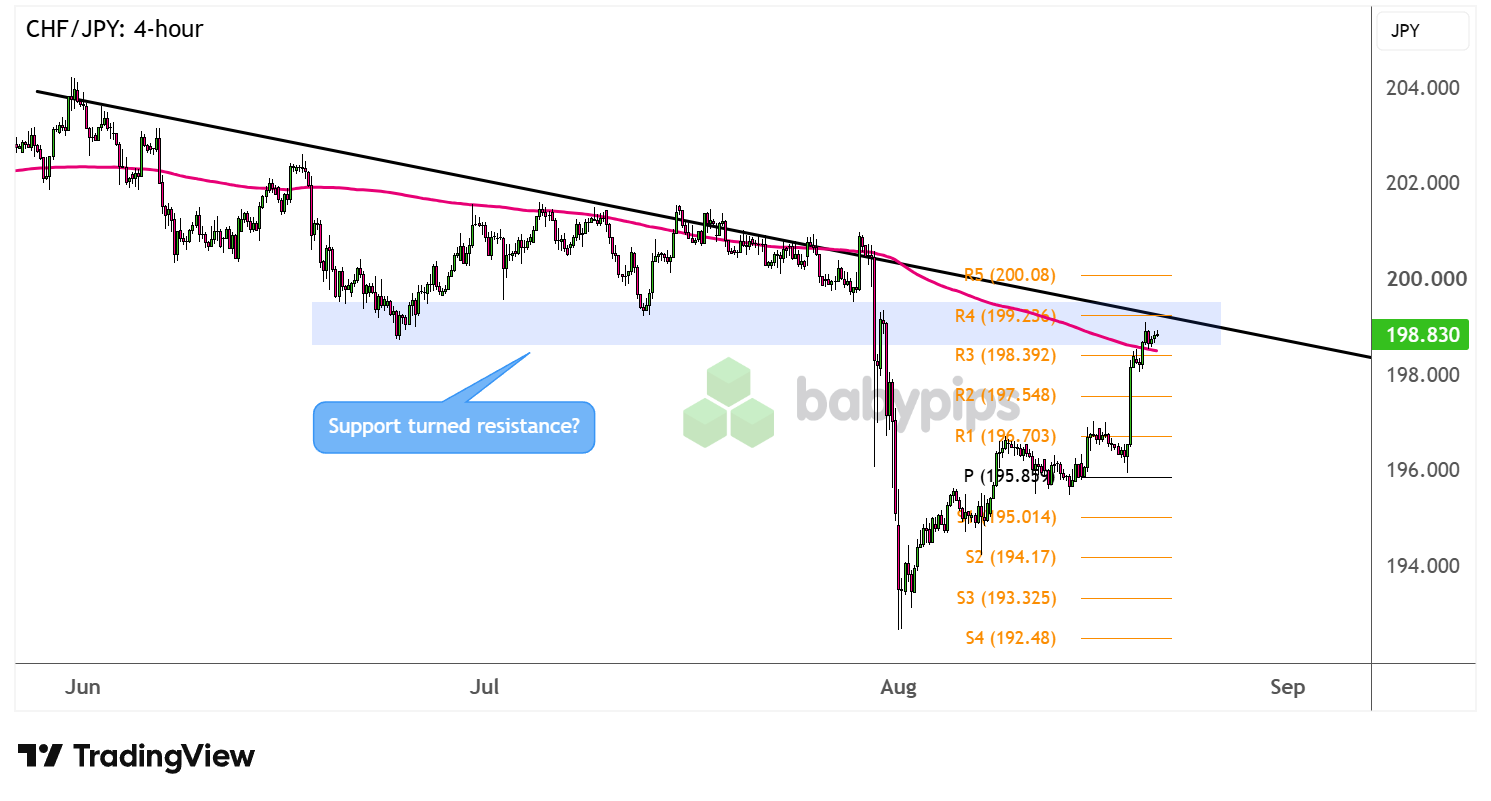
CHF/JPY has pulled higher after Japan’s massive yen-tervention in late July, hovering around a descending trend line and area of interest.
Will it hold as resistance?
CHF/JPY: 4-hour
CHF/JPY 4-hour Forex Chart Faster by TradingView
This yen pair has been rallying almost all month, possibly on profit-taking after the latest decline, making its way up to the descending trend line that’s been capping gains since June.
Risk-off flows from geopolitical uncertainty appear to have favored the Swiss franc while the Japanese yen has lost some of its safe-haven appeal on account of record-breaking declines in Asian equities recently.
But will the former support zone hold as a ceiling?
CHF/JPY is trading around the broken support near R4 (199.23) and the 200 SMA dynamic inflection point, both of which are aligned with the descending trend line resistance.Remember that directional biases and volatility conditions in market price are typically driven by fundamentals. If you haven’t yet done your fundie homework on the Swiss franc and the Japanese yen, then it’s time to check out the economic calendar and stay updated on daily fundamental news!
Keep your eyes peeled for reversal candlesticks or consolidation around this area, reflecting hesitation among buyers to extend the climb, as a return in selling pressure could drag price back to nearby bearish targets such as R2 (197.54) then R3 (196.70).
On the other hand, a long green candle closing past the area of interest could confirm that a reversal may be in order, possibly lifting CHF/JPY to the next ceiling at R5 (200.08), which coincides with a major psychological mark.
Whichever bias you end up trading, don’t forget to practice proper risk management and stay aware of top-tier catalysts that could influence overall market sentiment.
Disclaimer:
Please be aware that the technical analysis content provided herein is for informational and educational purposes only. It should not be construed as trading advice or a suggestion of any specific directional bias. Technical analysis is just one aspect of a comprehensive trading strategy. The technical setups discussed are intended to highlight potential areas of interest that other traders may be observing. Ultimately, all trading decisions, risk management strategies, and their resulting outcomes are the sole responsibility of each individual trader. Please trade responsibly.
CHF/JPY is currently testing a zone where a descending trend line, a broken support level, and the 200 SMA all converge, which is a textbook example of confluence at work. Premium members can read our lesson:
📖 Confluence: Stacking the Odds in Your Favor
Reading this helps you understand how to score a setup when multiple factors line up at the same price, why a zone like this carries more weight than an isolated trend line or moving average alone, and how that changes the way you read a potential reversal versus a breakout.
And if you’re not a Premium subscriber yet, consider joining.
With Babypips Premium, you get full access to School of Pipsology lessons that help you understand not just where a level sits on the chart, but how to weigh the strength of a setup when several signals stack up at once.



