


CAD/JPY looks exhausted from its months-long climb!
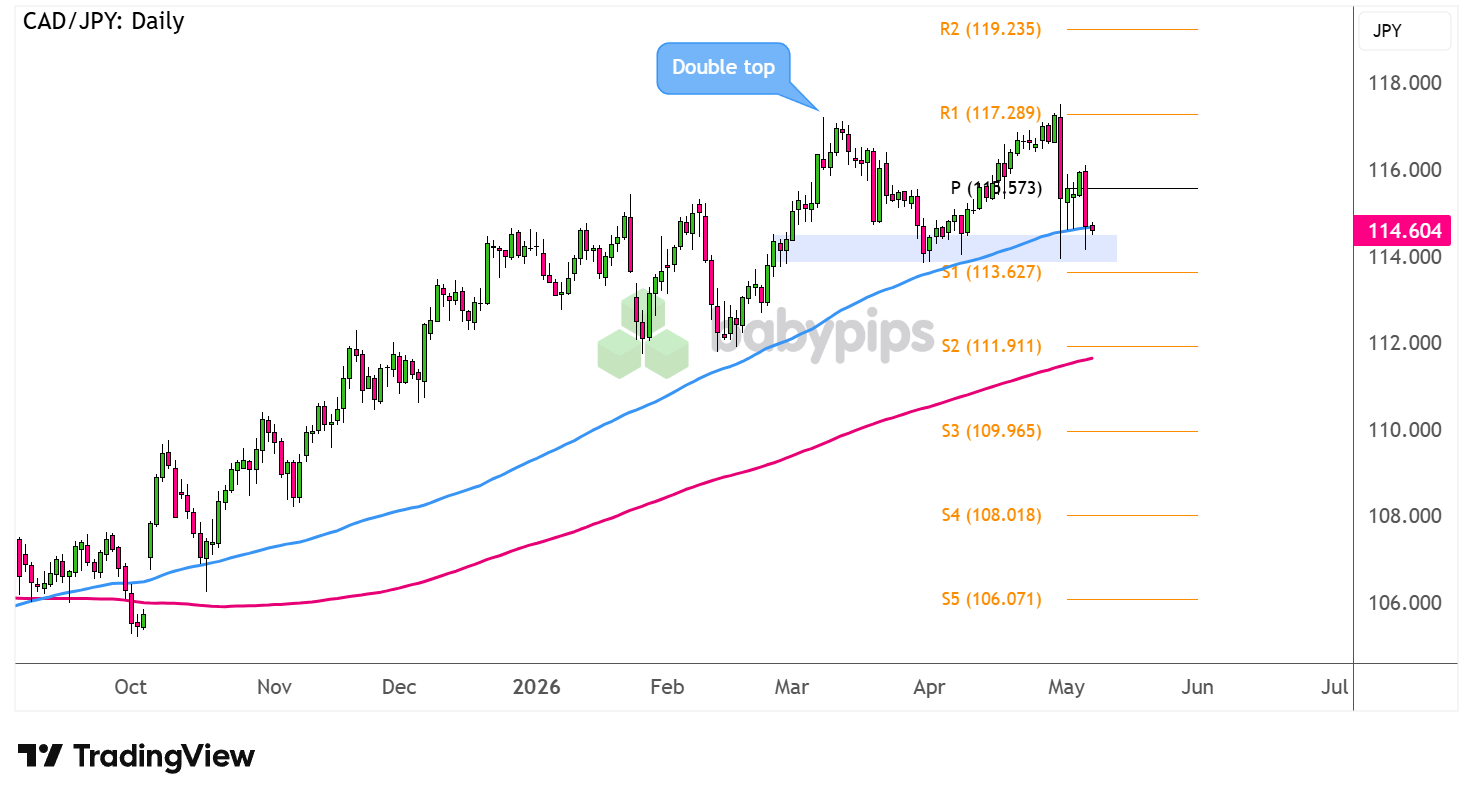
A double top pattern appears to have formed on the daily time frame, and price is currently testing the neckline support.
Will we see a reversal soon?
CAD/JPY: Daily
CAD/JPY 4-hour Forex Chart Faster With TradingView
Crude oil sold off sharply, dragging the correlated Loonie down with it in the past trading sessions thanks to stronger prospects of a US-Iran peace deal.
At the same time, the Japanese yen continues to attract buyers while traders remain on edge about another round of yen-tervention.
CAD/JPY made a couple of failed attempts to break above R1 (117.29) and is currently testing the reversal pattern’s neckline near S1 (113.63) near the 100 SMA dynamic support.
The 100 SMA remains above the 200 SMA and is increasing its lead, suggesting that bulls could still have the upper hand.Remember that directional biases and volatility conditions in market price are typically driven by fundamentals. If you haven’t yet done your homework on the Canadian dollar and the Japanese yen, then it’s time to check out the economic calendar and stay updated on daily fundamental news!
A bounce off the support region could lead to another test of the tops or at least the pivot point (115.57) area of interest. Keep an eye out for stronger bullish pressure that could trigger a sustained rally to the next upside target at R2 (119.23).
On the other hand, long red candles piercing below support could set off a drop that’s the same height as the chart formation. Look out for potential bounces off nearby bearish targets at S2 (111.91) near the 200 SMA dynamic support and S3 (109.96) as well.
Whichever bias you end up trading, don’t forget to practice proper risk management and stay aware of top-tier catalysts that could influence overall market sentiment.
Disclaimer:
Please be aware that the technical analysis content provided herein is for informational and educational purposes only. It should not be construed as trading advice or a suggestion of any specific directional bias. Technical analysis is just one aspect of a comprehensive trading strategy. The technical setups discussed are intended to highlight potential areas of interest that other traders may be observing. Ultimately, all trading decisions, risk management strategies, and their resulting outcomes are the sole responsibility of each individual trader. Please trade responsibly.
This CAD/JPY chart art analysis uses chart patterns, pivot points, and candlestick signals to frame a potential reversal, and if those tools are new to you, Premium members can read our lesson:
📖 Price Action Across Multiple Timeframes
Reading this helps you understand how to read the same asset across multiple chart timeframes, why a single-timeframe view gives you an incomplete picture, and how to identify the right direction and timing for a trade like this one.
And if you’re not a Premium subscriber yet, now’s a good time to sign up.
With Babypips Premium, you get full access to School of Pipsology lessons that help you understand not just what the channel and pivot levels are showing, but how to connect them across timeframes to form a complete trade thesis.


