





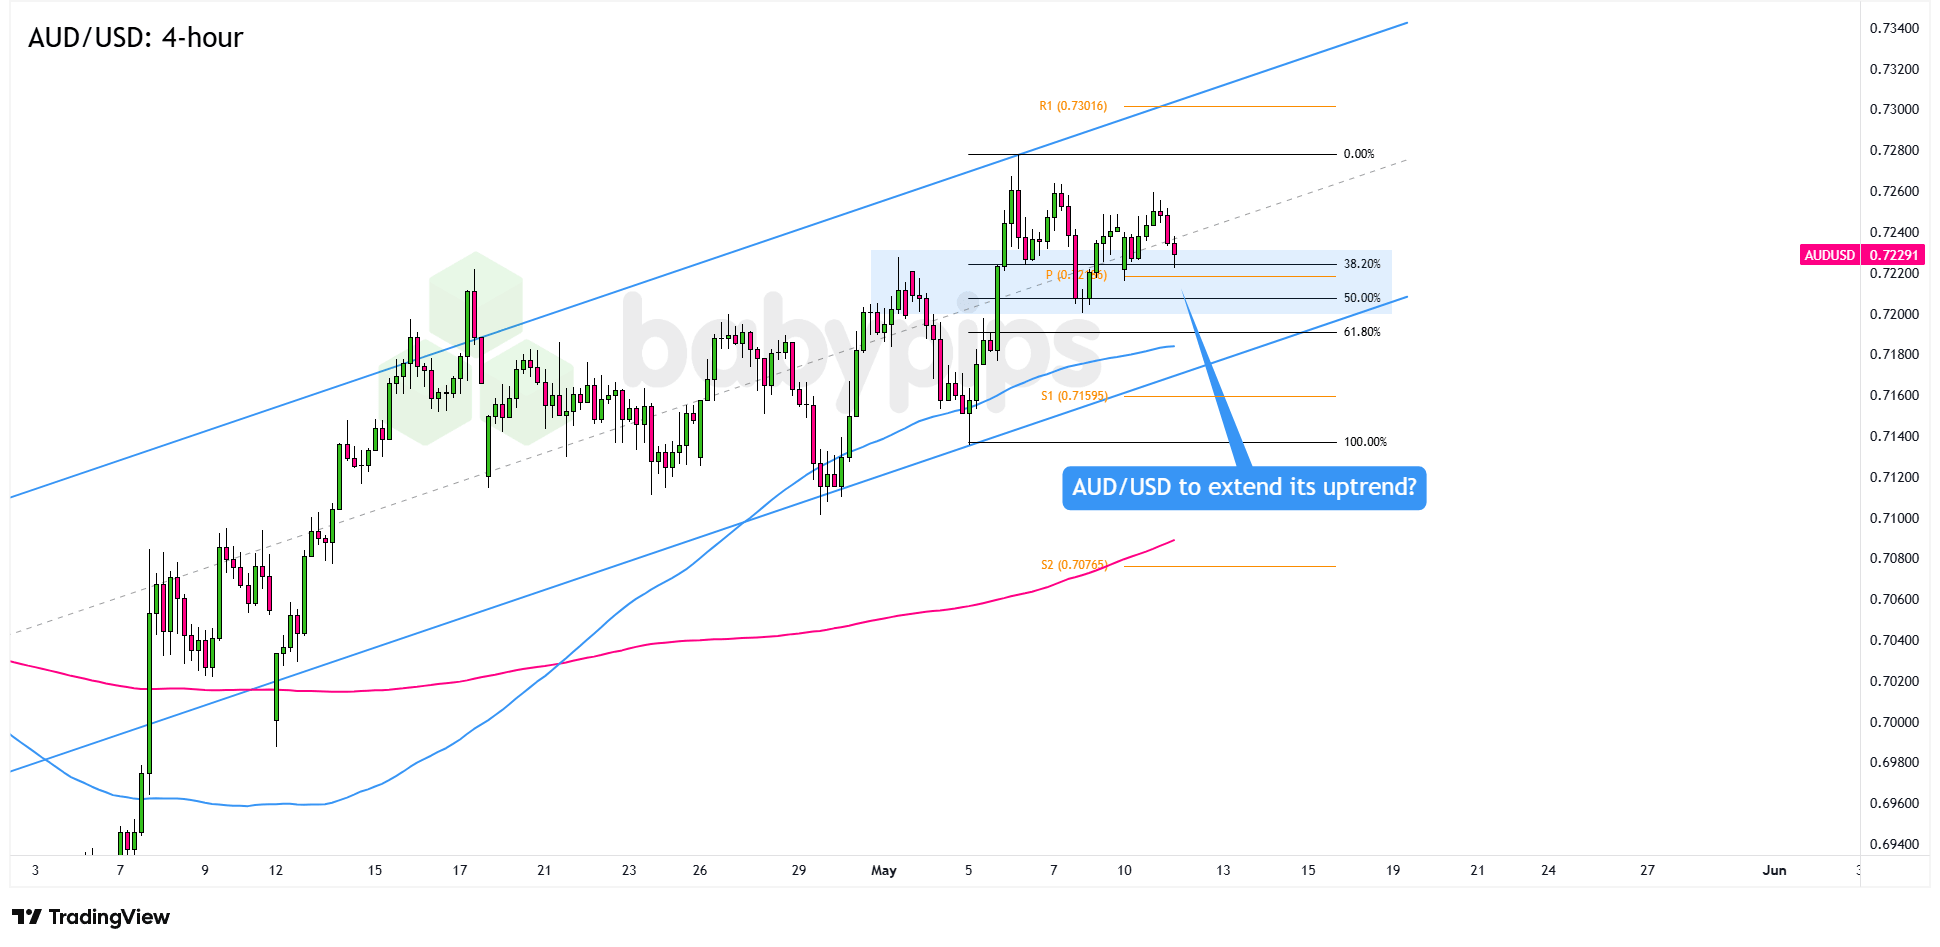
AUD/USD has been quietly grinding higher inside an ascending channel, while a fresh bullish SMA crossover has formed near the Pivot Point.
Could this give buyers the launchpad they need for a run toward fresh July highs?
Let’s take a closer look at the 4-hour time frame!
AUD/USD: 4-hour
AUD/USD 4-hour Forex – Chart Faster with TradingView
The weekend ceasefire between the U.S. and Iran sent oil lower and lifted risk appetite early Monday, giving the Aussie an initial boost. However, the mood soured through the London and U.S. sessions as a chipmaker led Wall Street selloff helped the Greenback regain ground ahead of Wednesday’s Fed decision.
AUD still finished higher, though it lagged most risk sensitive peers as gold pulled back. Next up are RBA Governor Bullock’s Tuesday speech and Australia’s CPI report, which could quickly reshape near term rate expectations. U.S.-Iran developments and the Fed remain the main drivers for the dollar.
AUD/USD has been printing higher lows inside an ascending channel since late June.Remember that directional biases and volatility conditions in market price are typically driven by fundamentals. If you haven’t yet done your fundie homework on the Australian dollar and the U.S. dollar, then it’s time to check out the economic calendar and stay updated on daily fundamental news!
A bullish SMA crossover recently formed near the channel floor and the Pivot Point at .6989, helping price rebound toward the middle of the channel. The Pivot Point is now acting as near term support, though the falling 200 SMA is still keeping a lid on rallies.
If AUD/USD holds above .7000, buyers could make another run at R1 near .7020, which lines up with the July highs. A clean break above that area could bring R2 near .7055 and fresh monthly highs into view.
But if price falls back below the Pivot and breaks the channel floor with conviction, the bullish setup starts to weaken. The SMAs could then turn into resistance, opening the door to S1 at .6951 and possibly S2 near .6923.
Whichever bias you end up trading, don’t forget to practice proper risk management and stay aware of top-tier catalysts that could influence overall market sentiment.
This AUD/USD setup is built around three technical factors converging at the same price level, and not every trader knows how to evaluate that kind of alignment. Premium members can read our lesson:
📖 Confluence: Stacking the Odds in Your Favor
Reading this helps you understand how confluence scoring works, why a Pivot Point, SMA crossover, and channel support all aligning at one level create a higher-conviction zone, and how to assess whether a setup has enough factors stacked in its favor before you trade it.
And if you’re not a Premium subscriber yet, now’s a good time to sign up.
With Babypips Premium, you get full access to School of Pipsology lessons that help you understand not just what the levels are on a chart, but how to score whether the factors aligning at those levels give you a genuine edge.



