


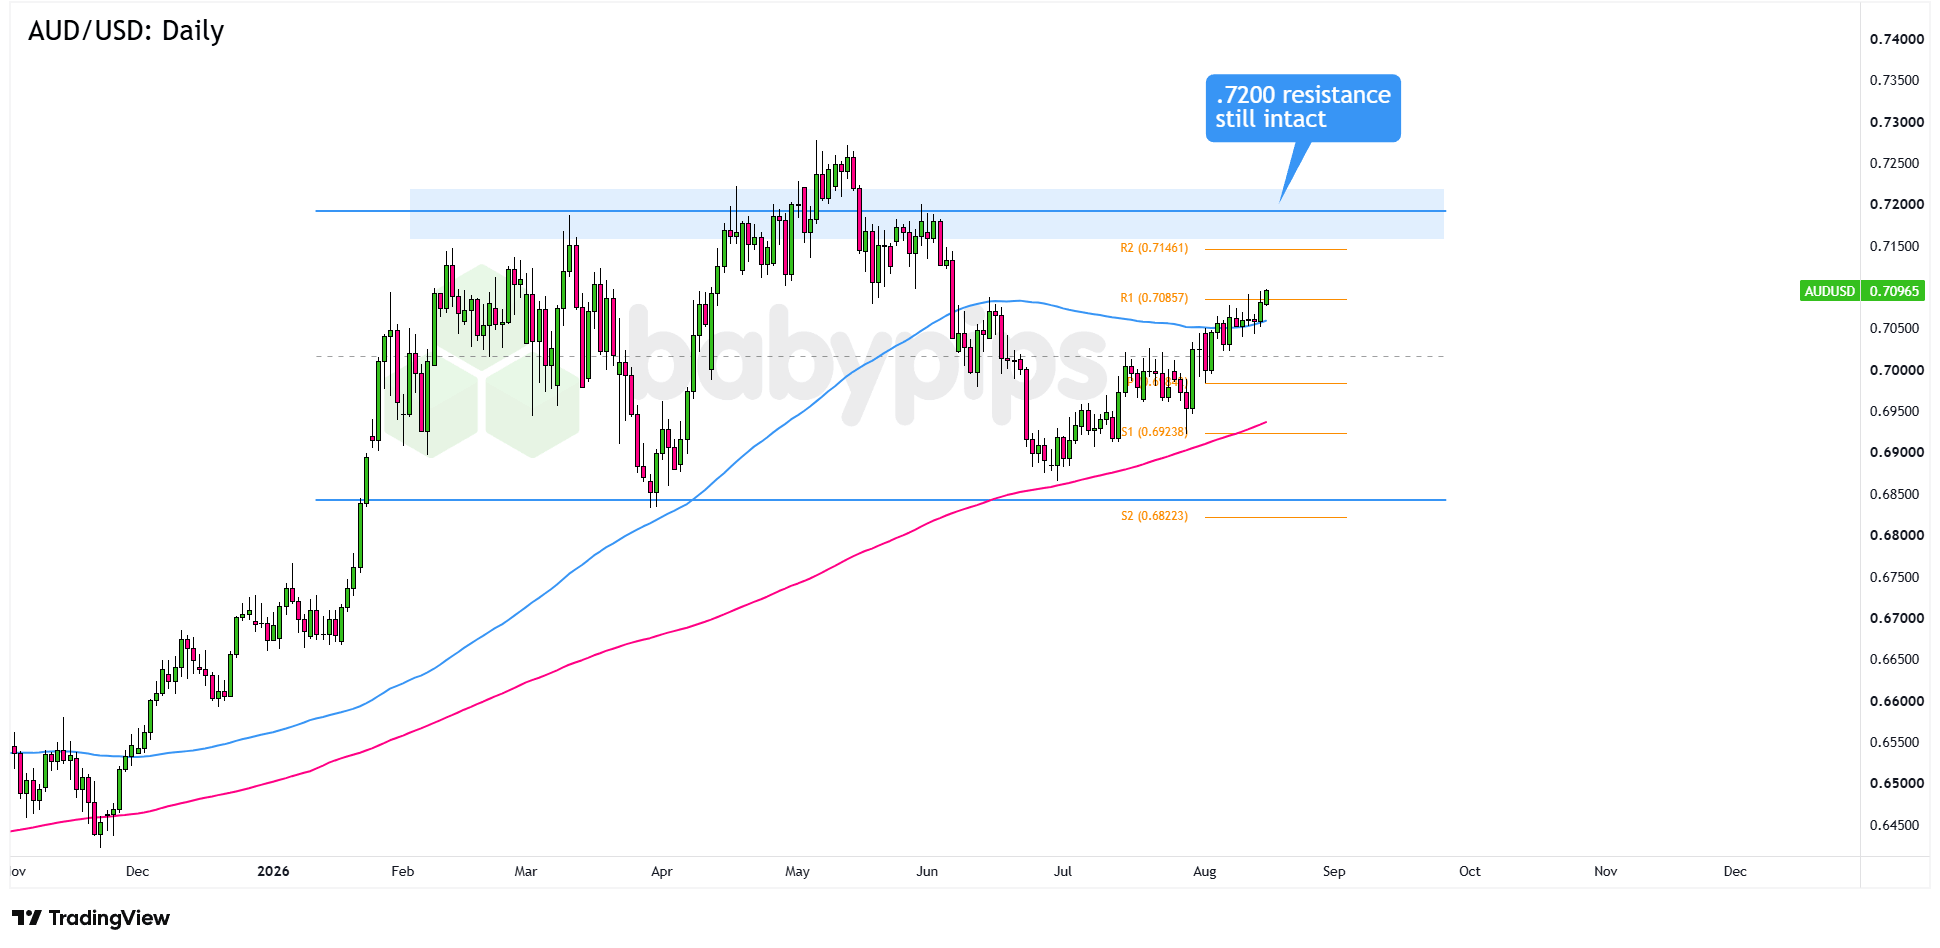
AUD/USD has cleared the 100 SMA and is now making a run at the .7200 area, which has kept the bulls in check for much of the year.
Can the pair finally break through, or are sellers getting ready to defend this key resistance zone?
Let’s take a closer look at the daily time frame:
AUD/USD: Daily
AUD/USD Daily Forex – Chart Faster with TradingView
The Aussie has found some support as U.S.-Iran nuclear talks remain stalled. The 60-day negotiation deadline passed last week without a signed agreement, keeping geopolitical uncertainty alive while limiting fresh demand for the Greenback.
Australia will release its July labor market figures on Thursday. June delivered a solid 76,300 employment gain while unemployment held steady at 4.4%, so another upbeat report could put a little more wind behind the Aussie’s sails.
The FOMC minutes from the Fed’s July 29 meeting are also due this week. With Chair Kevin Warsh’s committee leaning hawkish and nine of 18 policymakers projecting at least one rate hike before year-end, any confirmation of that bias could stir up fresh demand for the dollar.
AUD/USD has staged a solid recovery from its late June lows near .6900, clearing the 100 SMA and R1 at .7086 along the way.Remember that directional biases and volatility conditions in market price are typically driven by fundamentals. If you haven’t yet done your fundie homework on the Australian dollar and the U.S. dollar, then it’s time to check out the economic calendar and stay updated on daily fundamental news!
The pair is now closing in on R2 at .7146, with the .7200 psychological level and previous resistance zone waiting just overhead.
If AUD/USD stays above the 100 SMA and breaks through R2 at .7146, buyers could set their sights on the .7200 psychological level and previous range resistance zone. A clean break and daily close above that level could open the door to .7300, followed by the bigger medium-term target at .7350 if bullish momentum sticks around.
On the flip side, if sellers defend the .7146 to .7200 area and bearish reversal candles start piling up, the 100 SMA near .7050 could be the first stop on a pullback. A deeper drop could put the S1 Pivot Point at .6924 back on the radar, followed by broader support at the 200 SMA near .6822.
Whichever bias you end up trading, don’t forget to practice proper risk management and stay aware of top-tier catalysts that could influence overall market sentiment.
AUD/USD is pressing into the .7200 area, a resistance zone that has capped the pair for much of the year, and if range-bound market dynamics are unfamiliar territory, our lesson explains the concept in detail. Premium members can read our lesson:
📖 What Is a Range-Bound Market?
Reading this helps you understand how to identify a ranging market, why certain price levels keep acting as reliable resistance, and how to read when a pair might be setting up to break out of a long-established range.
And if you’re not a Premium subscriber yet, now’s a good time to sign up.
With Babypips Premium, you get full access to School of Pipsology lessons that help you understand not just what range resistance looks like on a chart, but the market dynamics that explain why those levels hold and what changes when they finally break.



