


AUD/CAD just broke above a key resistance zone and could be headed for its next major inflection point.
But with a former ceiling coming into view, could sellers step in and turn the pair lower?
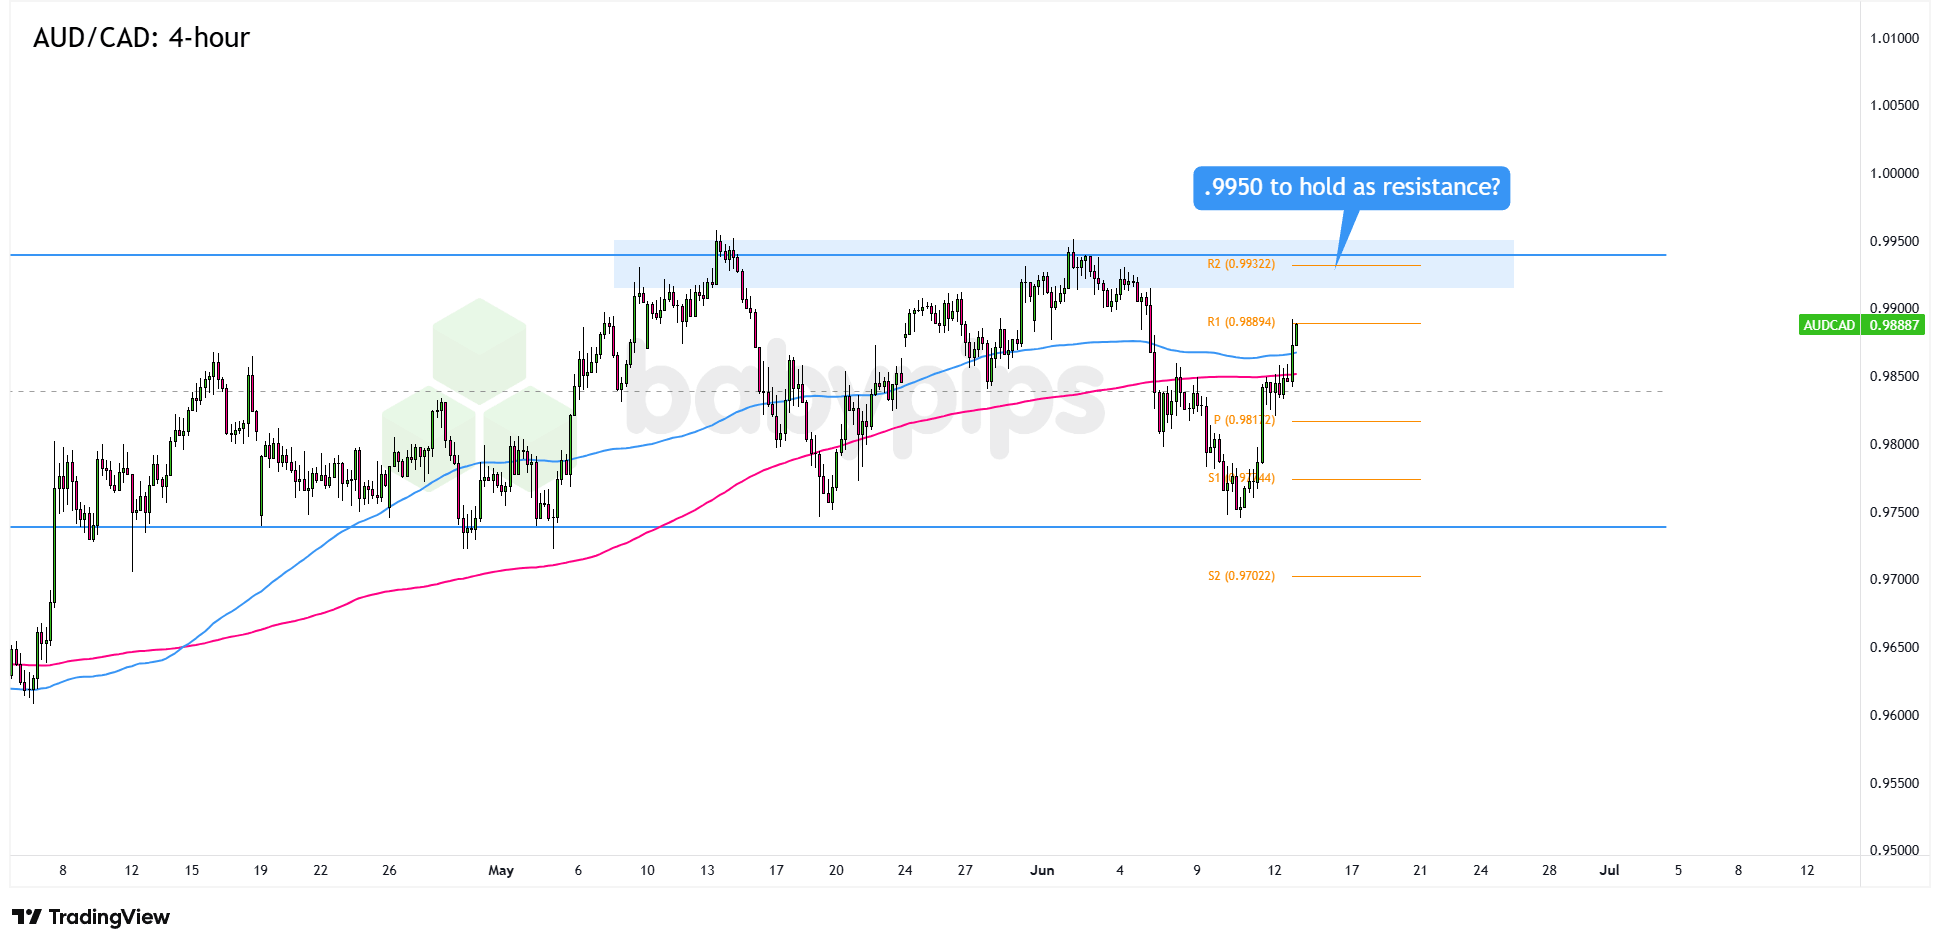
Here’s what we’re seeing on the 4-hour time frame:
AUD/CAD: 4-hour
AUD/CAD 4-hour Forex Chart Faster with TradingView
The Australian dollar turned in a mixed performance last week, weighed down by soft Australian data and choppy risk sentiment as traders reacted to shifting headlines around the U.S.-Iran conflict.
The Canadian dollar had an even rougher run, finishing as the weakest major currency as lower crude oil prices dragged on the oil-linked Loonie.
That setup could change this week as traders watch for progress on the U.S.-Iran peace deal while also preparing for a fresh round of catalysts on the calendar, including a parade of lower-tier reports from Canada later today.
AUD/CAD turned lower from the .9950 range resistance area we flagged earlier this month, then found support around the .9750 zone, which lines up with a range floor that has been in play since April.Remember that directional biases and volatility conditions in market price are typically driven by fundamentals. If you haven’t yet done your homework on the Australian dollar and the Canadian dollar, then it’s time to check out the economic calendar and stay updated on daily fundamental news!
The pair has now broken above the .9850 mid-range area, where the 100 and 200 SMAs are also hanging out.
This puts a possible move back toward the .9950 previous resistance zone on the radar, especially since the level now sits near this week’s R2 Pivot Point at .9932.
If this week’s catalysts push AUD/CAD beyond its May and early June resistance zone, then the big 1.0000 psychological handle could be the next area to watch.
But if sellers show up again around .9950, AUD/CAD could slide back toward the .9850 mid-range level, if not all the way down to the .9750 range support zone.
Whichever bias you end up trading, don’t forget to practice proper risk management and stay aware of top-tier catalysts that could influence overall market sentiment!
This AUD/CAD setup is built around a defined trading range between .9750 and .9950, and readers unfamiliar with range-bound market structure may want more context on what makes this type of environment distinct. Premium members can read our lesson:
📖 What Is a Range-Bound Market?
Reading this helps you understand how to identify a ranging market, why price tends to oscillate between defined floors and ceilings, and why a level like .9850 becomes a key reference point when a pair is trading inside a range.
And if you’re not a Premium subscriber yet, now’s a good time to sign up.
With Babypips Premium, you get full access to School of Pipsology lessons that help you understand not just what the chart is showing, but the market structure concepts that make range setups like this one readable in the first place.


