


Remember that AUD/CAD range resistance setup we were watching a few days back?
Well, the pair did turn lower from that area and has now slipped below mid-range support, putting the next nearby inflection points back on the radar.
Can lower oil prices help slow the Loonie’s roll and keep the .9750 range floor intact, or is this breakdown only getting started?
Here’s what we’re looking at on the 4-hour time frame:
AUD/CAD: 4-hour
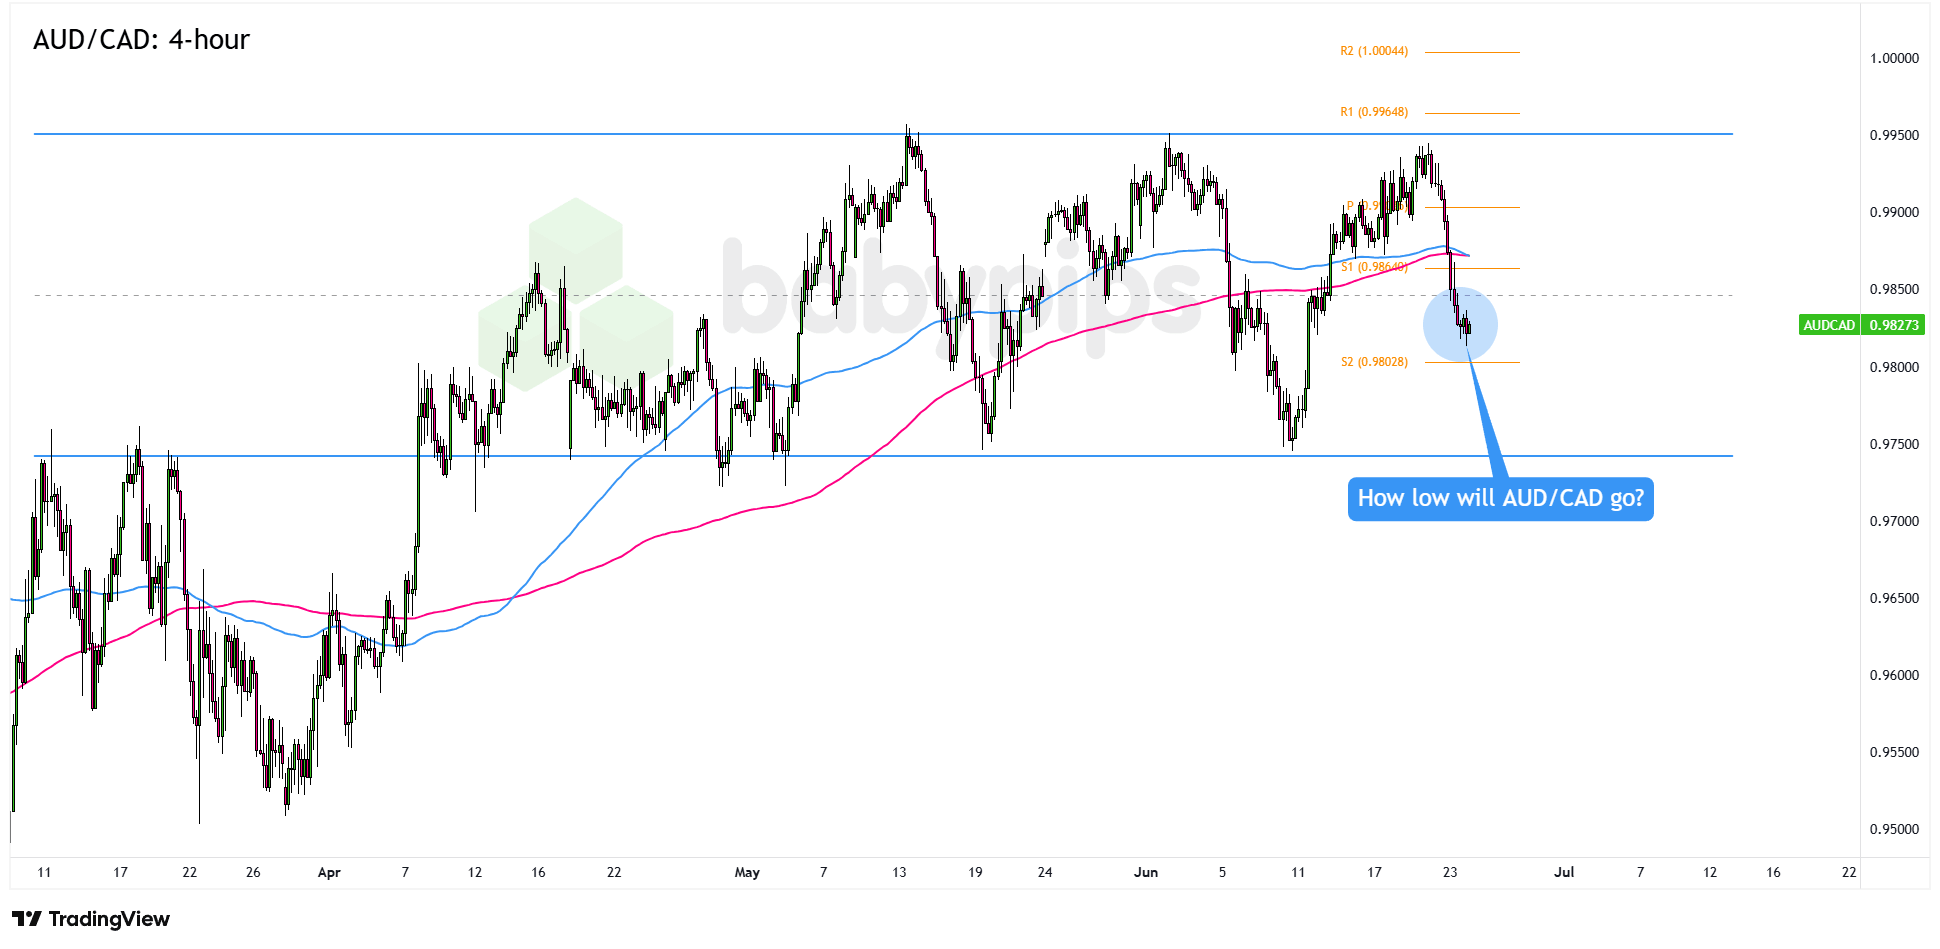
AUD/CAD 4-hour Forex Chart Faster with TradingView
Australia’s May CPI cooled to 4.0% y/y from 4.2% in April, extending its pullback from March’s 4.6% peak and giving traders another reason to cool down RBA rate hike expectations ahead of this week’s Australian jobs report.
That leaves the Aussie looking vulnerable, although the Loonie isn’t exactly getting a free ride either. WTI crude slipped roughly 1.15% on Tuesday as the Strait of Hormuz continued to reopen, easing one of CAD’s key supports and potentially limiting how much Loonie strength can add to AUD/CAD’s downside pressure.
Remember that directional biases and volatility conditions in market price are typically driven by fundamentals. If you haven’t yet done your homework on the Australian dollar and the Canadian dollar, then it’s time to check out the economic calendar and stay updated on daily fundamental news!
AUD/CAD broke sharply below S1 at .9856 during Tuesday’s risk-off selloff, and Australia’s softer CPI print hasn’t done much to stop the bleeding.
Price is now hovering near .9825, with both moving averages rolling over above price and keeping the bearish bias in play. For now, the pair is stuck between former S1 resistance at .9856 and S2 support at .9803.Zooming out, the broader range is still marked by the .9950 resistance ceiling and the .9750 support floor, while .9850 remains the mid-range checkpoint to watch on any recovery attempt.
Watch for price to stabilize above S2 at .9803, especially if softer crude oil prices keep CAD demand in check. That could give AUD/CAD buyers a shot at pushing back toward the .9850 mid-range area, then possibly toward R1 near .9965.
Australia’s jobs report is the next big Aussie wildcard this week, and a stronger headline print could give the pair a better chance of retesting the .9950 range resistance.
On the flip side, if fading RBA rate hike expectations keep dragging the Aussie lower and AUD/CAD breaks below S2 at .9803, the well-established .9750 range floor could be the next stop.
Whichever bias you end up trading, don’t forget to practice proper risk management and stay aware of top-tier catalysts that could influence overall market sentiment!
This AUD/CAD setup is built around a defined trading range between .9750 and .9950, and readers unfamiliar with range-bound market structure may want more context on what makes this type of environment distinct. Premium members can read our lesson:
📖 What Is a Range-Bound Market?
Reading this helps you understand how to identify a ranging market, why price tends to oscillate between defined floors and ceilings, and why a level like .9850 becomes a key reference point when a pair is trading inside a range.
And if you’re not a Premium subscriber yet, now’s a good time to sign up.
With Babypips Premium, you get full access to School of Pipsology lessons that help you understand not just what the chart is showing, but the market structure concepts that make range setups like this one readable in the first place.


