


U.S. crude oil prices just bounced from a previous support zone!
Will this lead to WTI crude making countertrend moves in the next trading sessions?
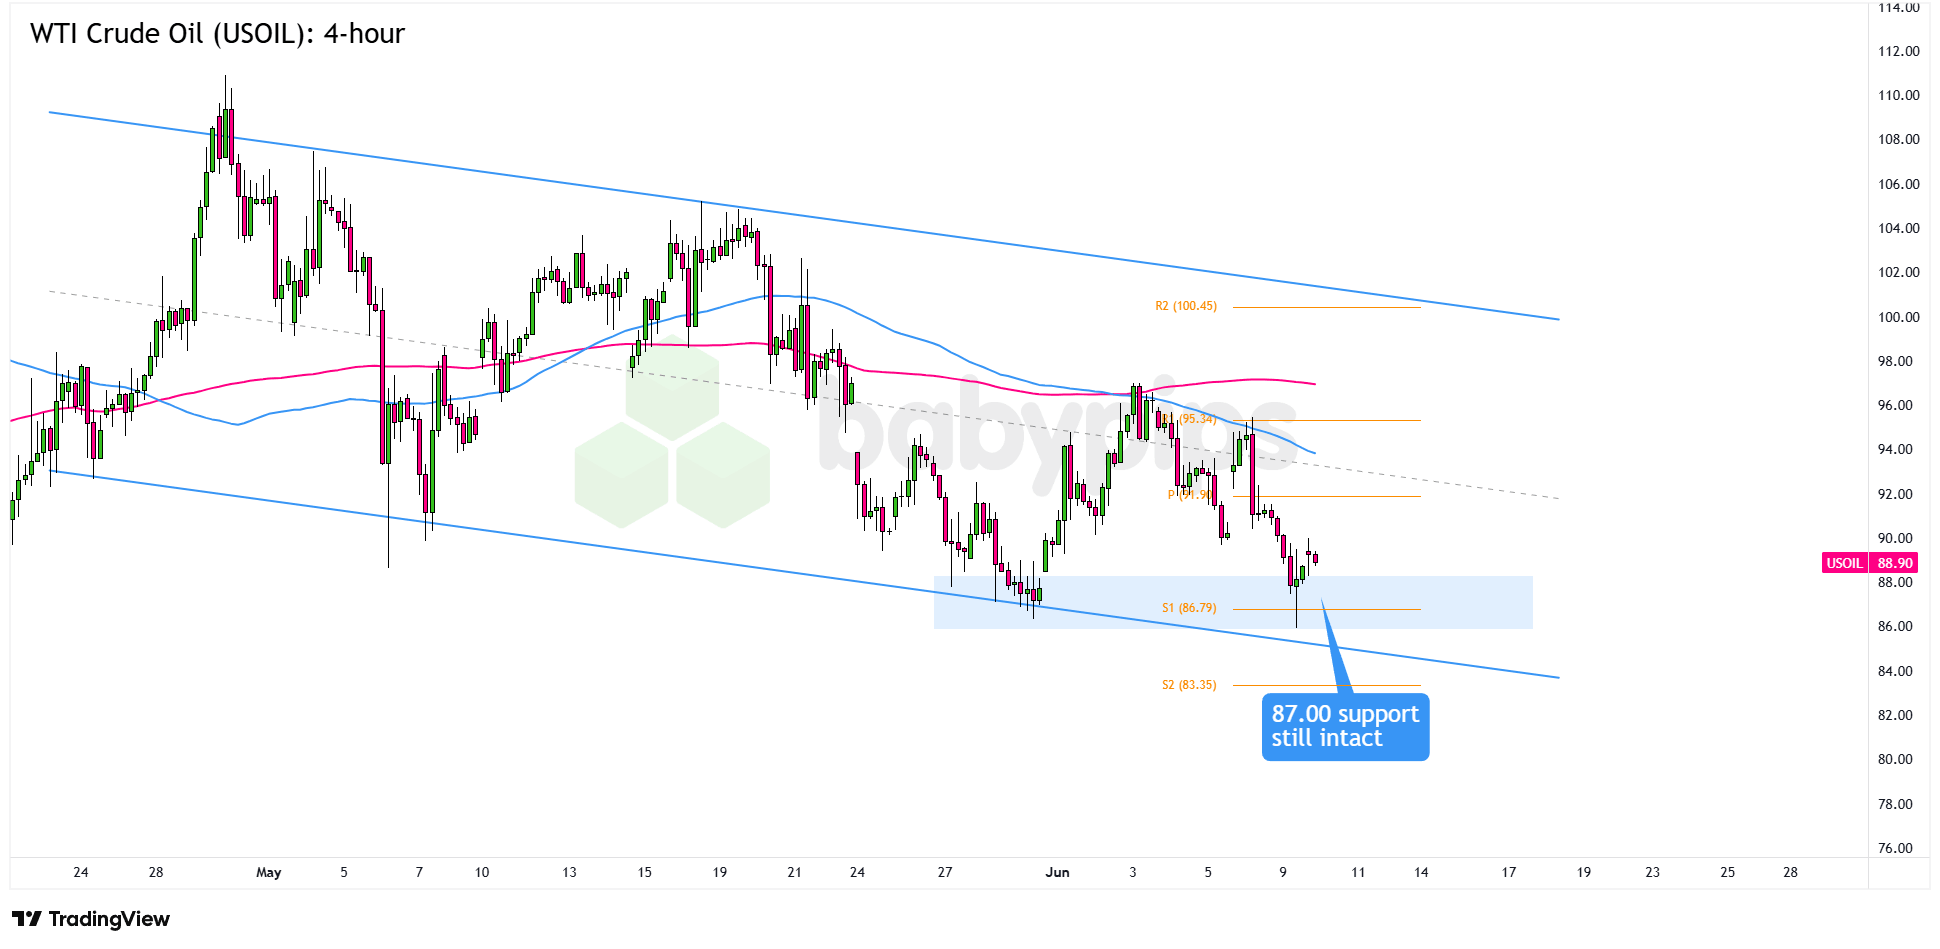
We’re taking a closer look at the 4-hour time frame!
WTI Crude Oil (USOIL): 4-hour
WTI Crude Oil (USOIL) 4-hour Chart Faster with TradingView
Crude oil prices have been sliding since the start of the week, even as military tensions between Iran, the U.S., and Israel have flared up again.
One possible reason is that traders are still leaning on hopes for an Iran-Israel ceasefire, along with signs that a broader U.S.-Iran peace deal may still be on the table.
But with Trump flagging fresh tensions tied to a helicopter incident in the Strait of Hormuz, and USOIL bouncing from a key technical support zone, WTI could be setting up for countertrend moves in the next few trading sessions.
USOIL, which had been trending lower since the start of the week, bounced from the 86.00 psychological level that lines up with a key support area from May.Remember that directional biases and volatility conditions in market price are typically driven by fundamentals. If you haven’t yet done your homework on WTI crude oil and the U.S. dollar, then it’s time to check out the economic calendar and stay updated on daily fundamental news!
A couple more bullish candlesticks and sustained price action above the $86.00 to $87.00 zone could draw in more buying pressure and lift USOIL back toward the $90.00 area of interest.
A stronger bounce could even put the $92.50 mid channel zone in play, especially since it sits closer to the 100 and 200 SMAs.
On the other hand, another swing lower and sustained bearish pressure below the S1 Pivot Point at $86.79 and the $86.00 previous low could open the door to a move toward the $80.00 psychological handle, if not the $75.50 previous inflection point.
Whichever bias you end up trading, don’t forget to practice proper risk management and stay aware of top-tier catalysts that could influence overall market sentiment.
Please be aware that the technical analysis content provided herein is for informational and educational purposes only. It should not be construed as trading advice or a suggestion of any specific directional bias. Technical analysis is just one aspect of a comprehensive trading strategy. The technical setups discussed are intended to highlight potential areas of interest that other traders may be observing. Ultimately, all trading decisions, risk management strategies, and their resulting outcomes are the sole responsibility of each individual trader. Please trade responsibly.
This article examines a USOIL bounce from the $86 to $87 key support zone, and if you want a deeper look at how to evaluate areas like this one, Premium members can read our lesson:
📖 Beyond Support and Resistance: Supply and Demand Zones
Reading this helps you understand how to identify quality demand zones, why some support levels carry more weight than others, and how to assess whether a bounce from a zone is worth trading.
And if you’re not a Premium subscriber yet, now’s a good time to sign up.
With Babypips Premium, you get full access to School of Pipsology lessons that help you understand not just where price bounced, but why certain zones carry more weight than others and how to evaluate a setup before you trade it.


