





Gold has been in selloff mode so far this month, giving in to additional U.S. dollar strength after the Fed announced a hawkish hike.
Can the precious metal recover or is it due for more downside?
Check out this classic chart pattern on the 4-hour chart!
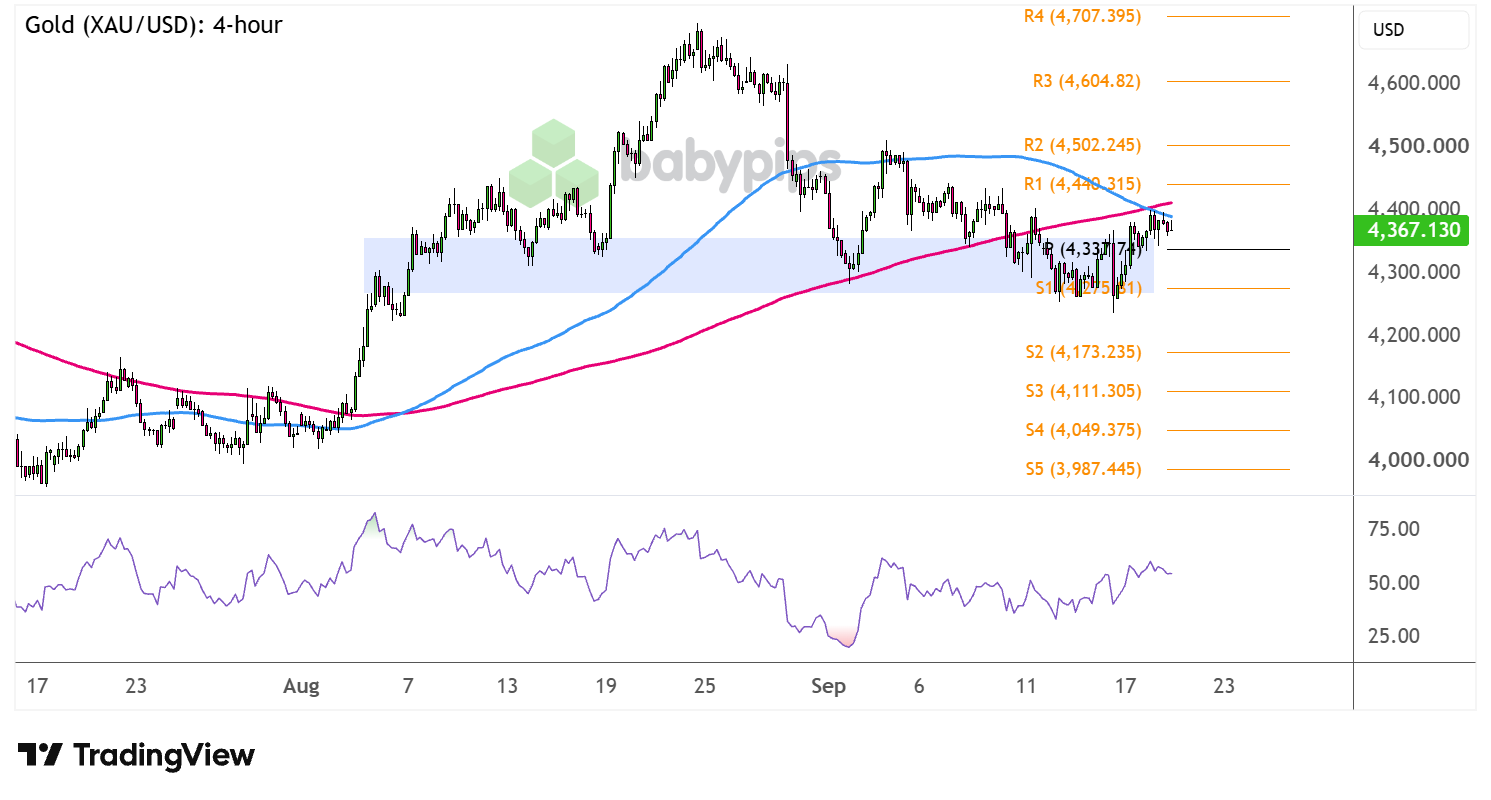
Gold (XAU/USD): 4-hour
Gold (XAU/USD) 4-hour Chart Faster with TradingView
Gold has hit the pause button on its climb and now seems to be completing a Head and Shoulders pattern, with price testing the neckline around the $4,300 mark.
Support appears to be holding so far, though, and the precious metal is now back above the pivot point ($4,337.74) to suggest bulls aren’t backing down so easily.
XAU/USD is hovering close to the dynamic inflection points at the moving averages, with the 100 SMA just crossing below the 200 SMA to reflect a pickup in bearish pressure.Remember that directional biases and volatility conditions in market price are typically driven by fundamentals. If you haven’t yet done your fundie homework on gold and the U.S. dollar, then it’s time to check out the economic calendar and stay updated on daily fundamental news!
Should these continue to hold as a ceiling, gold could revisit the neckline support near S1 ($4,275.31) or perhaps break lower, suggesting that a selloff that’s the same height as the formation is due.
If so, look out for a continuation of the slide to the next bearish targets at S2 ($4,173.23), then S3 ($4,111.30), or all the way down to the August lows.
On the other hand, a more decisive bounce past the $4,400 major psychological mark and R1 ($4,440.31) could suggest that buyers are eyeing further upside to R2 ($4,502.24) then R3 ($4,604.82).
Whichever bias you end up trading, don’t forget to practice proper risk management and stay aware of top-tier catalysts that could influence overall market sentiment!
Gold’s current selloff is tied to Fed rate hike expectations and broader U.S. dollar strength, forces that go well beyond the chart pattern on your screen. Premium members can read our lesson:
📖 What Makes Gold’s Price Move?
Reading this helps you understand how interest rate expectations drive gold’s price, why dollar strength and gold often move inversely, and how central bank policy shifts can turn a technical setup like a head and shoulders pattern into a real move.
And if you’re not a Premium subscriber yet, now’s a good time to sign up.
With Babypips Premium, you get full access to School of Pipsology lessons that help you understand not just where support and resistance sit on the chart, but the interest rate and dollar dynamics that decide whether those levels actually hold.



