


Spot gold (XAU/USD) prices are about to hit a key resistance zone!
Will the precious metal extend a months-long downtrend in the next trading sessions?
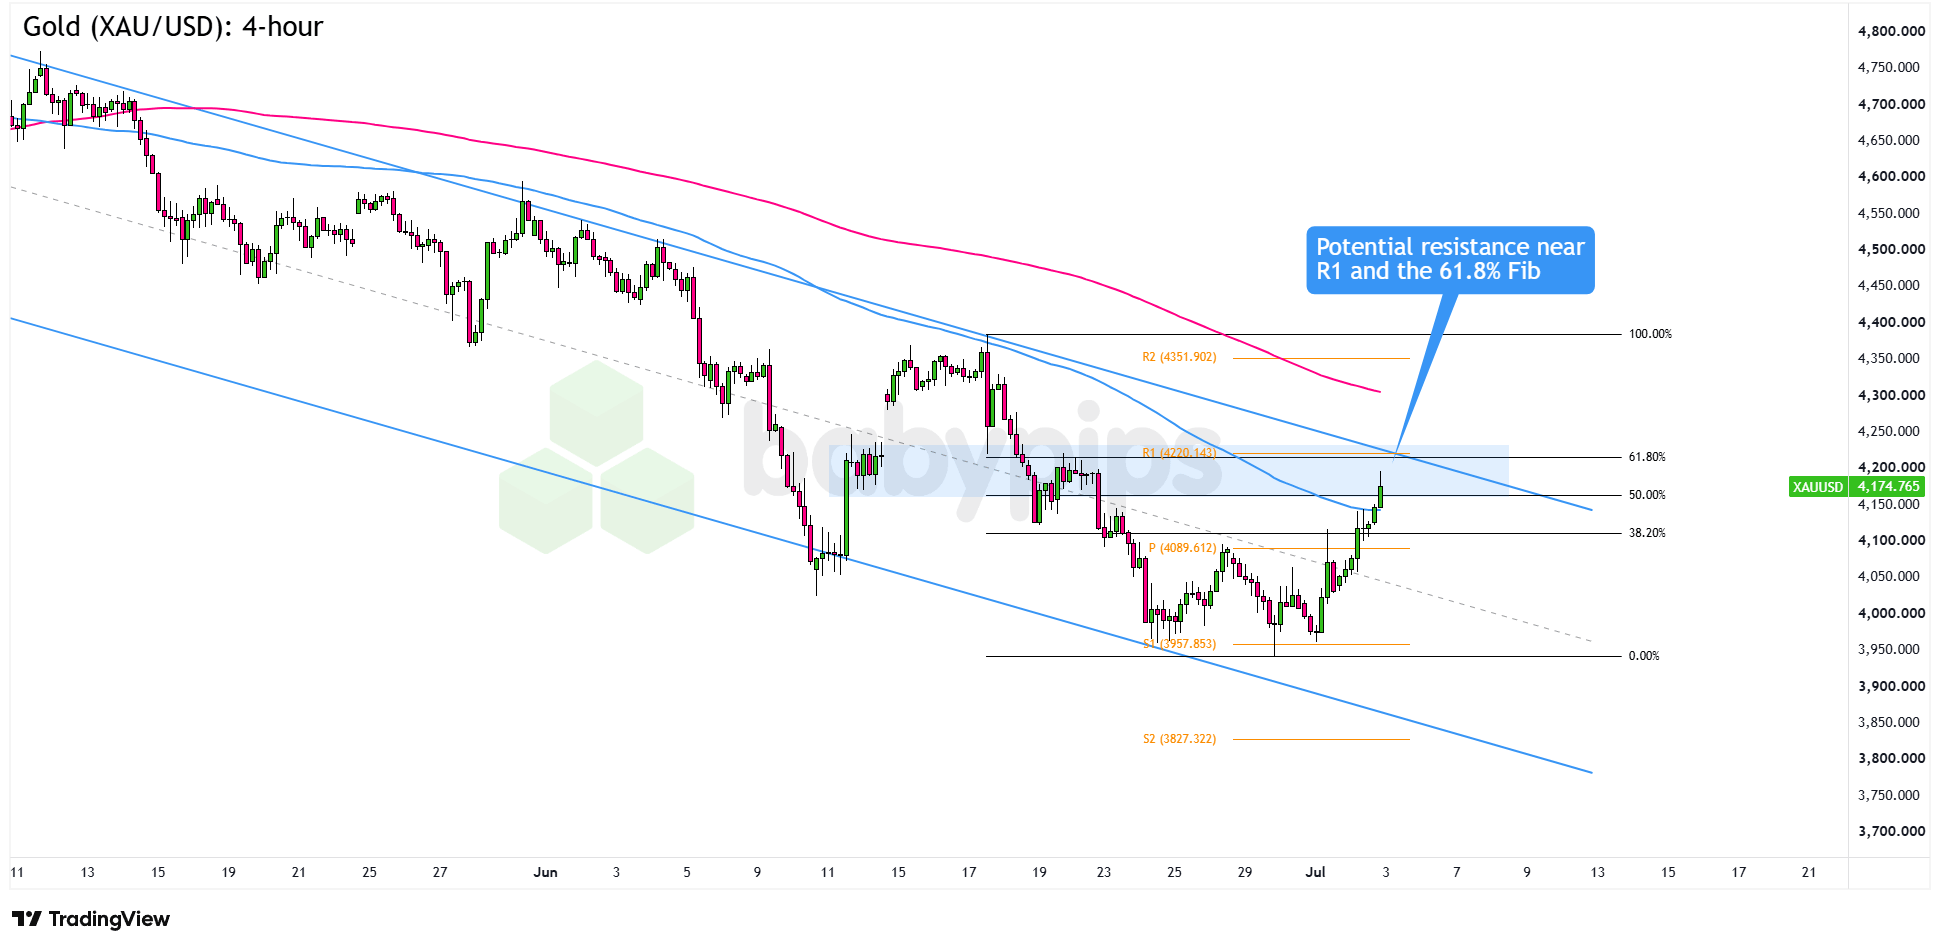
Let’s take a closer look at the 4-hour time frame:
Gold (XAU/USD): 4-hour
Gold (XAU/USD) 4-hour Chart Faster with TradingView
U.S. nonfarm payrolls came in at just 57,000 versus the 110,000 forecast, knocking the dollar to a two-week low and taking a big bite out of July rate hike pricing.
Gold caught a sharp bid after the data, but with U.S. markets closed Friday for Independence Day, thin holiday liquidity could make any follow-through pretty choppy.
Geopolitical risk hasn’t gone away either. The Doha talks between the U.S. and Iran ended without a breakthrough, keeping some safe haven premium in play.
That said, gradual progress in Strait of Hormuz shipping traffic has been eating into the supply risk bid that helped drive gold’s earlier highs.
XAU/USD has been making lower highs and lower lows inside a descending channel since mid-May, with the pair recently finding support from the $4,000 psychological handle.Remember that directional biases and volatility conditions in market price are typically driven by fundamentals. If you haven’t yet done your homework on gold and the U.S. dollar, then it’s time to check out the economic calendar and stay updated on daily fundamental news!
Thursday’s surge pushed gold toward a stacked resistance zone where the channel top, the R1 Pivot Point ($4,220.14), and the 61.8% Fibonacci retracement of the late June downswing all line up.
If that cluster holds, a pullback toward the Pivot Point ($4,089.61) may be on the table. A deeper drop toward S2 ($3,827.32) could also come into play if the dollar gets back on its feet.
But if bulls can clear the channel top and stay above it, then the 200 SMA zone and the R2 ($4,351.90) Pivot Point come into view, with a possible momentum all the way up to $4,350.
Whichever bias you end up trading, don’t forget to practice proper risk management and stay aware of top-tier catalysts that could influence overall market sentiment.
Please be aware that the technical analysis content provided herein is for informational and educational purposes only. It should not be construed as trading advice or a suggestion of any specific directional bias. Technical analysis is just one aspect of a comprehensive trading strategy. The technical setups discussed are intended to highlight potential areas of interest that other traders may be observing. Ultimately, all trading decisions, risk management strategies, and their resulting outcomes are the sole responsibility of each individual trader. Please trade responsibly.
This XAU/USD chart centers on a stacked resistance zone where the descending channel top, R1 Pivot Point, and 61.8% Fibonacci retracement all converge at the same price level, a technical setup built entirely on confluence. Premium members can read our lesson:
📖 Confluence: Stacking the Odds in Your Favor
Reading this helps you understand how stacking multiple technical factors at a single level changes the probability of a setup, how to score any price action entry before you take it, and why three factors converging at the same zone creates a fundamentally different trade than one.
And if you’re not a Premium subscriber yet, consider signing up.
With Babypips Premium, you get full access to School of Pipsology lessons that help you understand not just where a key level sits on the chart, but how many technical factors are stacking there and why that changes the weight of the setup.


