
This August, Bitcoin and Coca-Cola were forcing traders to ask how much higher is too high.
Bitcoin has finally broken the downtrend we highlighted in our previous analysis, while Coca-Cola has pushed into uncharted territory at a new all-time high.
So, do you follow the momentum — or start looking for the reversal?
Let’s read some charts.
₿ Bitcoin Finally Broke the Trendline
Last month, we asked whether Bitcoin was building a base around $60,000 — or simply pausing before another leg lower. Now we have an answer.
Bitcoin has delivered one of its strongest rallies of 2026, surging from around $63,000 to above $81,000 in little more than a week. The move briefly took BTC to its highest level since May.
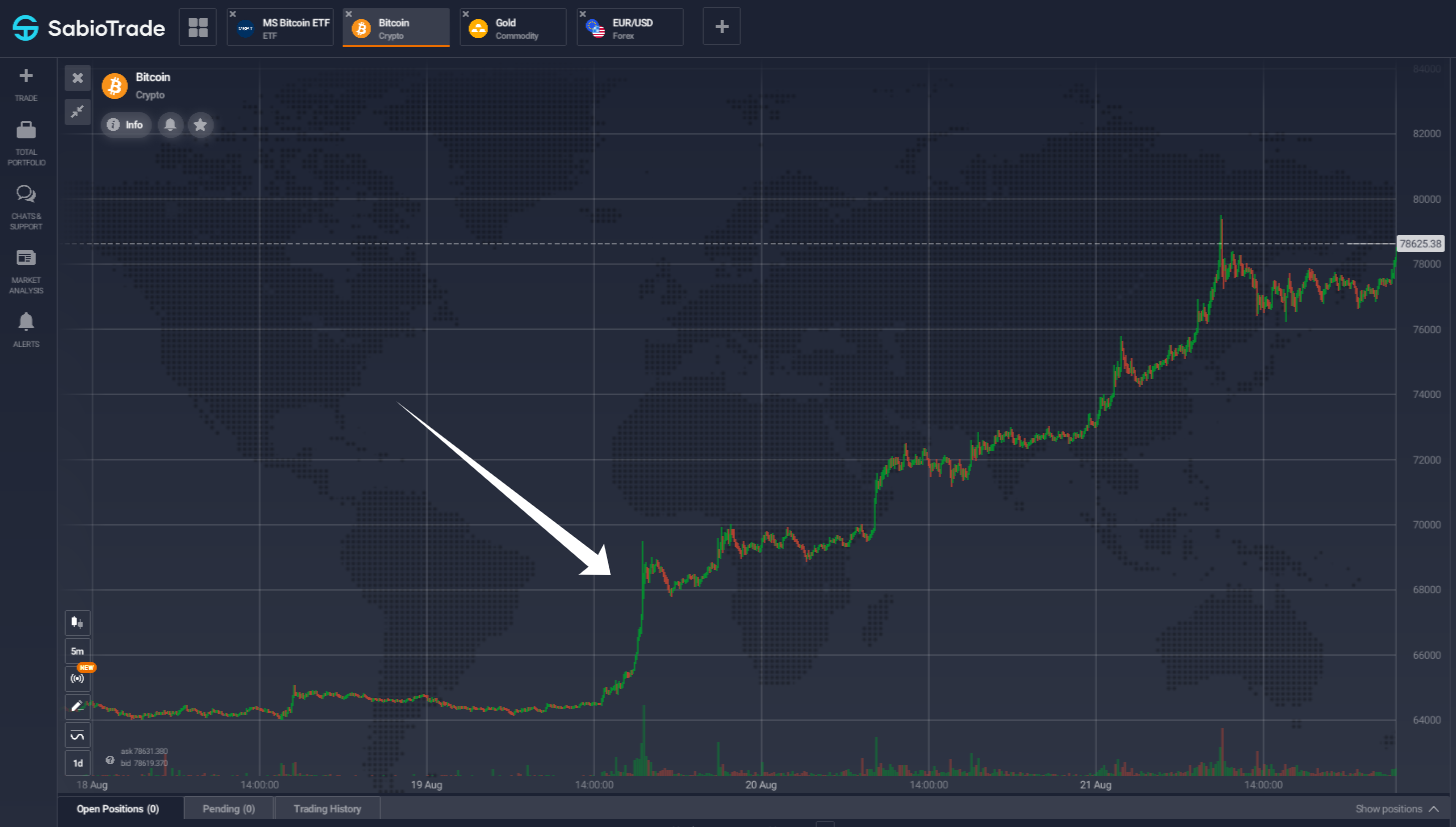
More importantly, it did something we’d been waiting for since our previous analysis:
Bitcoin finally broke the long-term descending trendline.
The $60K Support Picture
Since the beginning of 2026, Bitcoin had already tested the $60,000 support area three times.
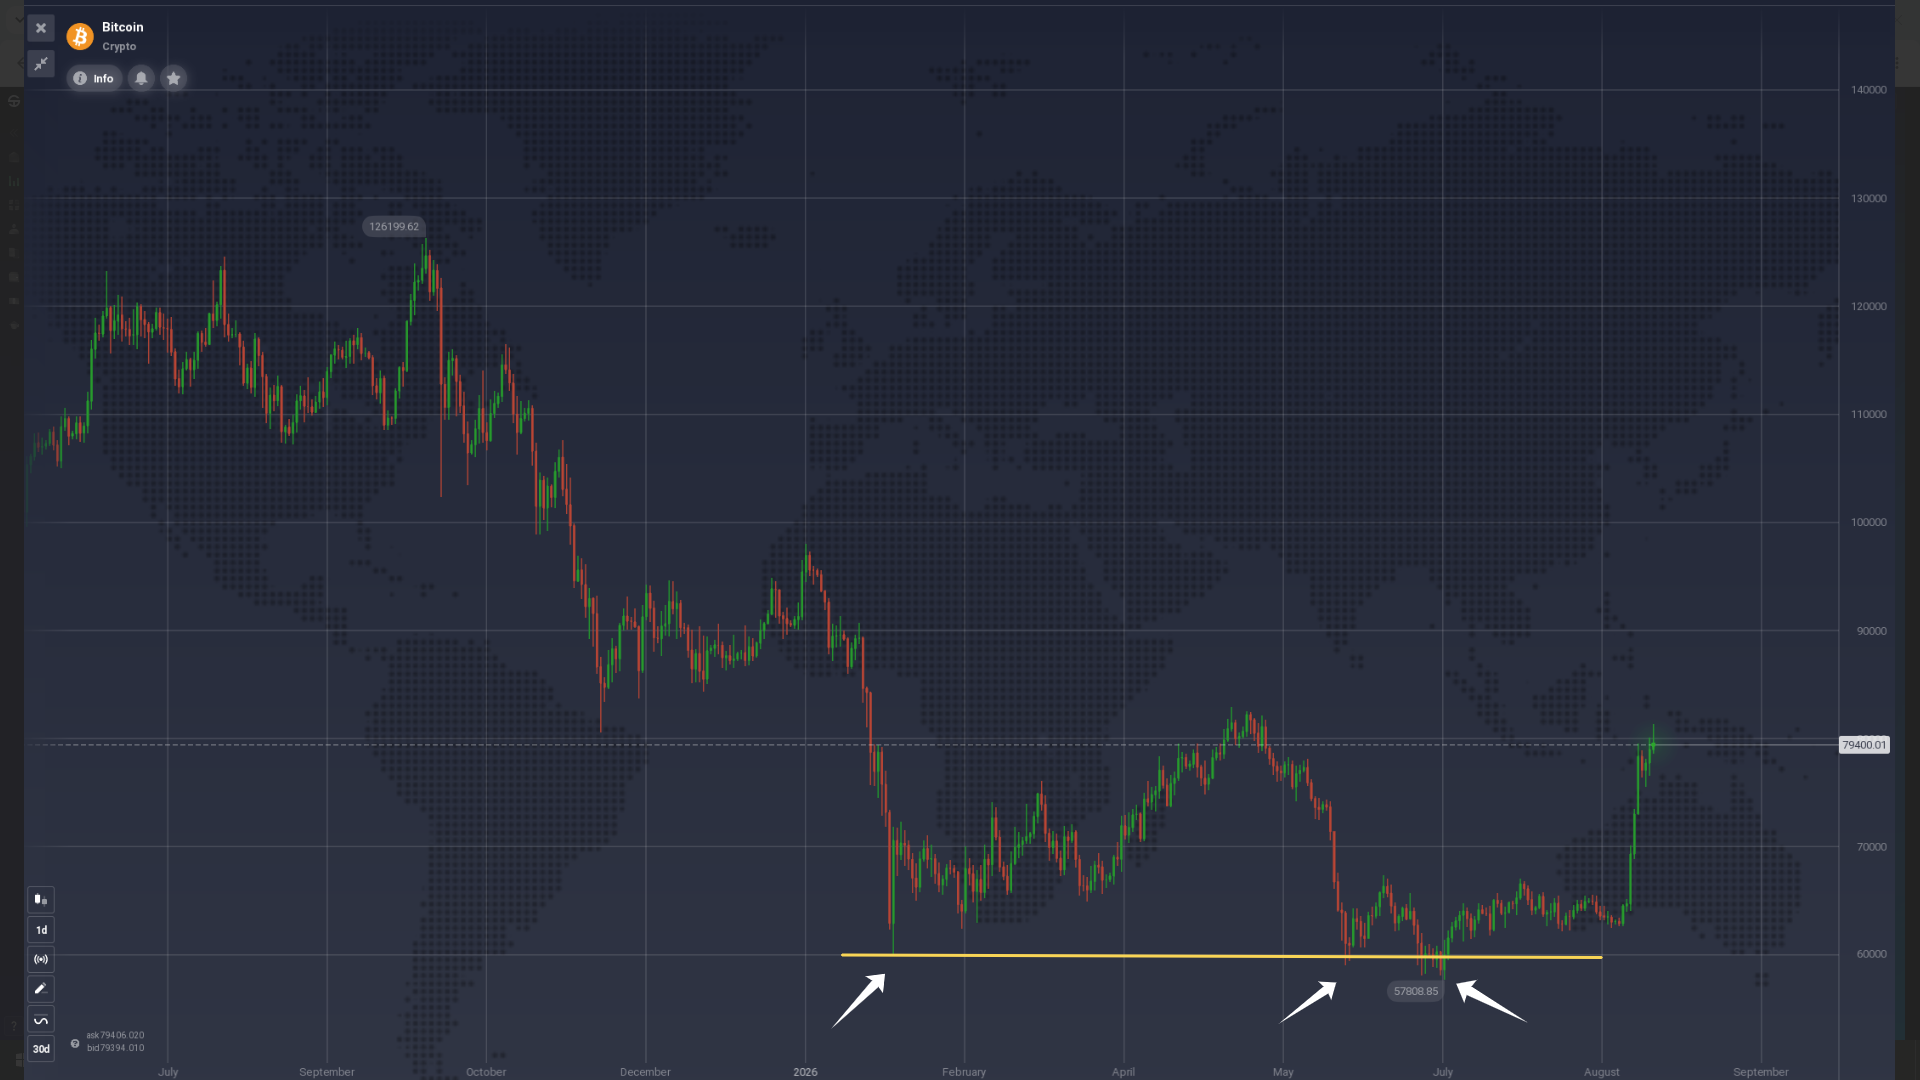
Each time, buyers stepped in. But we argued that this alone wasn’t enough to call a new bull trend: BTC was still trapped below the descending trendline that had capped its previous rallies.
Fast-forward to August, and several pieces have fallen into place.
→ $60K support held
→ the descending trendline broke
→ BTC accelerated above $80K.
Spot Bitcoin ETFs have also seen renewed demand: U.S. spot BTC ETFs attracted around $1.9 billion in the latest reported week, their strongest weekly inflow of 2026.
That’s a much stronger technical picture than the one we were looking at a month ago.
Trading the Breakout
A bullish breakout doesn’t mean Bitcoin moves higher in a straight line.
BTC jumped more than 20% in roughly a week and briefly reached about $81,200, before pulling back below $80K. After an impulse this strong, some consolidation or profit-taking would be completely normal.
So the question now is:
Can Bitcoin hold the breakout — and how far can the new move go?
$84,000 Is the Next Big Test
The area around $81K–$84K is now the immediate battlefield. Bitcoin has already tested the lower part of this zone and retreated.
A sustained move through roughly $84K would therefore be much more meaningful than simply seeing another green day. Technical analysts are similarly watching an approximately $81.5K–$84.4K resistance zone, with a sustained break potentially opening substantially higher levels.
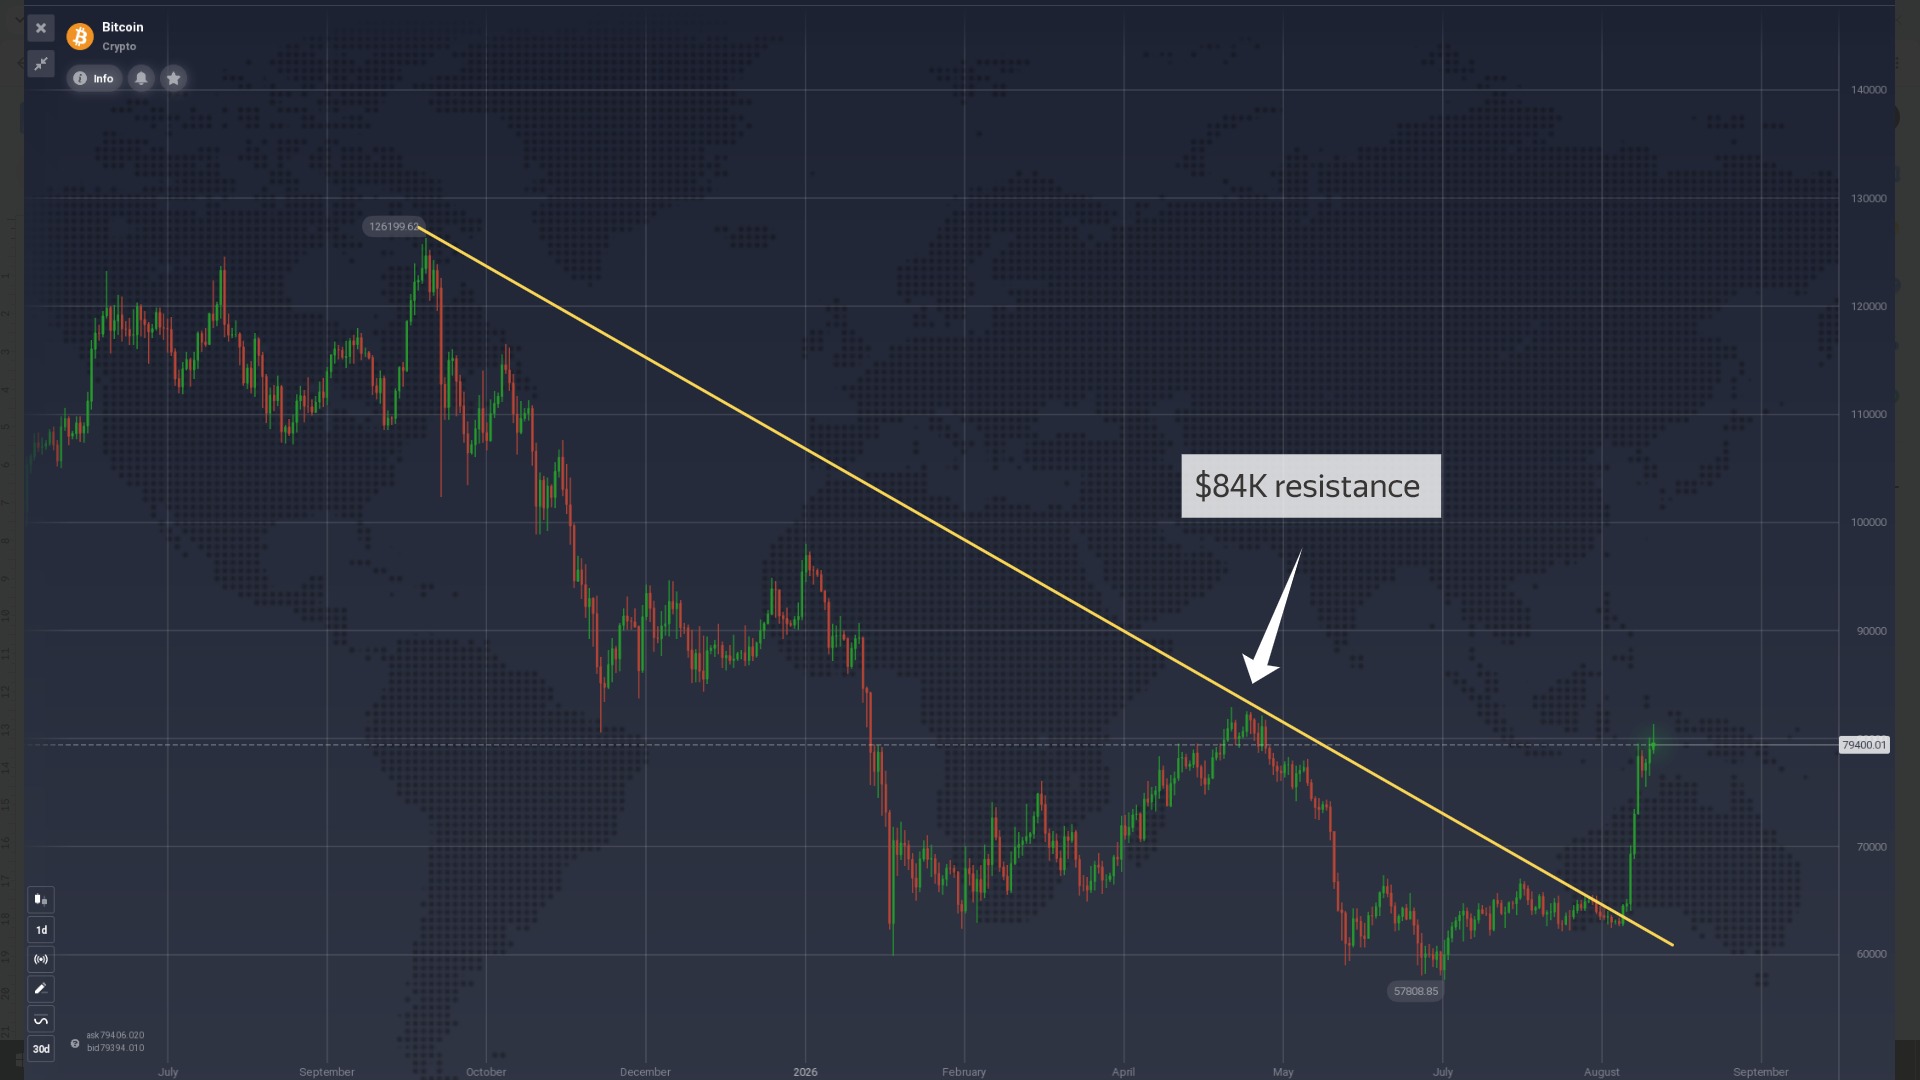
That gives traders two very different scenarios.
- Bullish scenario: BTC consolidates without giving back much of the August rally, forms a higher low, and eventually breaks through $84K. That would strengthen the case that the old downtrend has genuinely transitioned into a new bullish structure.
- Warning scenario: BTC repeatedly fails around $81K–$84K and begins losing the levels reclaimed during the breakout. That wouldn’t automatically restore the old bear trend, but it would suggest the market needs more time before another attempt higher.
BTC Trader’s Watchlist
- $81K–$84K resistance. This is the key hurdle immediately ahead.
- The breakout zone. Watch whether former resistance begins behaving as support during pullbacks.
- Higher lows. After such a fast rally, the shape of the next correction may tell us more than another vertical move higher.
- ETF flows. Continued institutional inflows would add fundamental support to the technical breakout.
- Volume. A move through $84K backed by strong buying volume would carry considerably more weight than a brief intraday spike.
The Bigger Lesson
Last month, $60K support gave us a reason to watch Bitcoin — but not yet a reason to declare the downtrend over.
Bitcoin has now provided the breakout. The bullish case has become substantially stronger — but after one of its fastest rallies of the year, the better question isn’t simply “Will BTC go higher?”
It’s where buyers are willing to defend the move — and whether they can finally push through $84K.
Coca-Cola at an All-Time High: Keep Buying — or Is It Getting Too Expensive?
Bitcoin isn’t the only asset breaking important levels. Coca-Cola has climbed to a new all-time high above $92, after a remarkably strong run for a stock normally associated with stability rather than explosive growth. KO is up roughly 31%[a] in 2026, making it one of the strongest performers among Warren Buffett’s major holdings.
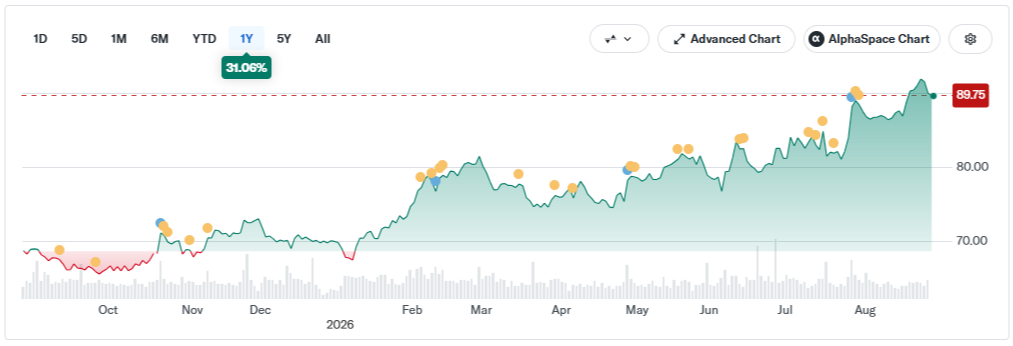
When a stock reaches an all-time high, there is no historical resistance above it. So is Coca-Cola entering another leg higher — or has the market pushed a defensive stock too far?
What’s Happened?
The latest push wasn’t purely technical.
Coca-Cola’s Q2 results beat expectations, with earnings rising 11% and revenue 6%. Global unit case volume increased 5%, while Coca-Cola Zero Sugar volume jumped 16%. The company also expanded its operating margin despite inflationary pressure.
That combination — rising earnings + resilient demand + defensive reputation — has kept buyers interested even as the valuation climbed.
No Resistance? Not Quite.
All-time highs create an unusual technical setup.
Normally, traders can look left on the chart and identify previous peaks where sellers appeared.
Above $92.49, there aren’t any.
That’s called price discovery: the market has to establish what buyers are actually willing to pay without an old resistance level providing an obvious reference point.
For bulls, that’s attractive — there are no trapped buyers from previous highs waiting to sell just to break even.
For bears, however, the same chart raises another question:
How much good news is already priced in?
Some valuation models already describe Coca-Cola as expensive at current levels.
Did You Know? Buffett Has Been Drinking This Trade for 40 Years
There is another reason Coca-Cola is interesting at these levels: Warren Buffett.
Berkshire Hathaway started building its Coca-Cola position after the 1987 market crash and still owns 400 million shares, currently worth roughly $32.5 billion and representing around 11% of Berkshire’s U.S. equity portfolio.
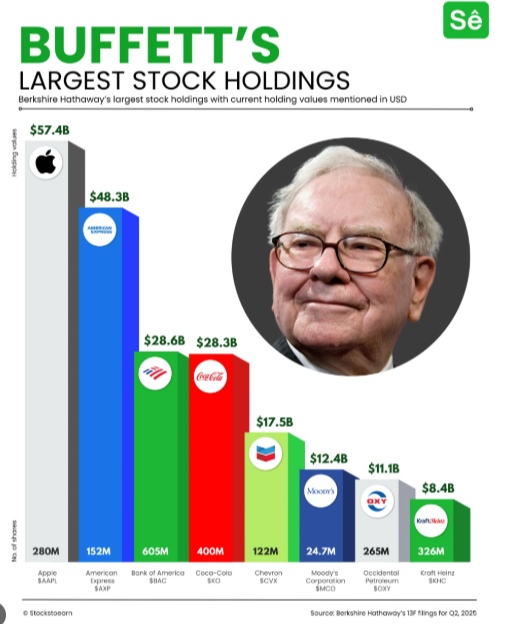
KO has increased its dividend for decades, turning Berkshire’s relatively modest original investment into a huge stream of recurring income. It’s a textbook example of Buffett’s preference for businesses with durable brands, predictable cash generation and long-term compounding.
But there’s an important distinction for traders:
Buffett buying Coca-Cola decades ago doesn’t automatically make KO attractive at $92.
So, Buy the Breakout or Short the High?
Right now, the trend clearly favors the bulls. Shorting a stock simply because it has reached an all-time high can be dangerous — there is no technical rule saying an expensive-looking asset can’t become even more expensive.
Instead, watch how KO behaves around its breakout.
- Bullish scenario: Coca-Cola holds above its previous breakout area around $90–91 and continues forming higher highs and higher lows. That would suggest buyers are accepting the new valuation and price discovery can continue.
- Bearish scenario: KO fails to hold the breakout and falls decisively back below the previous high. A failed breakout after such a long rally would be much more interesting to bears than the all-time high itself.
KO Trader’s Watchlist
- $92.49 ATH. Can KO establish itself above the new record?
- $90–91 breakout zone. Former resistance becoming support would strengthen the bullish case.
- Valuation. The higher KO climbs, the harder future earnings may need to work to justify the price.
- Earnings momentum. Q2 was strong; traders will want evidence that growth can continue.
- Pullbacks. After a strong multi-month rally, the reaction to the first meaningful correction may tell us more than another record high.
The Bigger Lesson
At record highs, the market is effectively running an experiment: how much are buyers willing to pay before demand finally dries up?
For Coca-Cola, the trend still says bulls are in control.
Now the interesting part begins: finding out whether $92 is another stepping stone — or the price where they finally blink.