
Looking back at July, two markets stand out — because they were not reacting the way they’re “supposed” to.
- The Japanese yen continues to trade near multi-decade lows (highs on USD/JPY) despite repeated warnings — and several interventions — from Japanese authorities before staging one of its sharpest one-day rallies in years.
- Bitcoin has spent much of the month holding above the key $60,000 support level, keeping traders divided over whether it’s building a base for a new rally or simply pausing before another leg lower.
Here’s what’s driving both markets — and what traders should keep an eye on in the weeks ahead.
💴 The Yen Is Rallying Again. Will It Last?
Few currencies have attracted more attention this year than the Japanese yen. Its story took another dramatic turn this week.
After spending most of July near its weakest levels in decades (near ¥164 per dollar), the currency suddenly surged nearly 3% against the U.S. dollar in a single session.
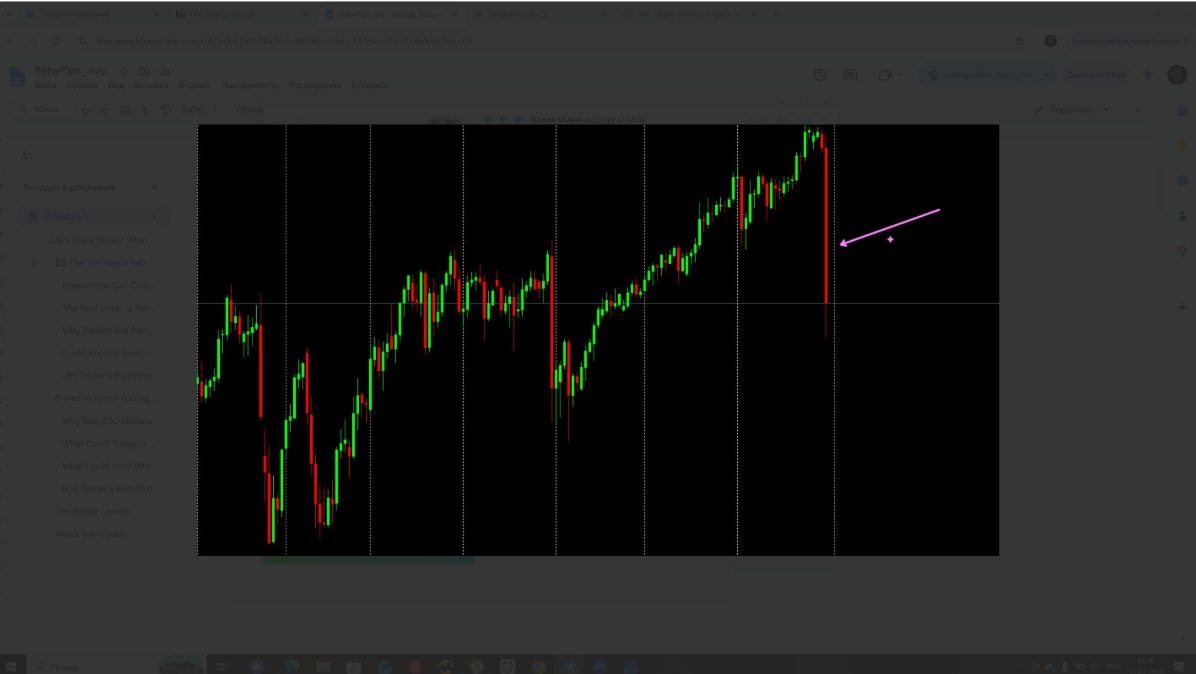
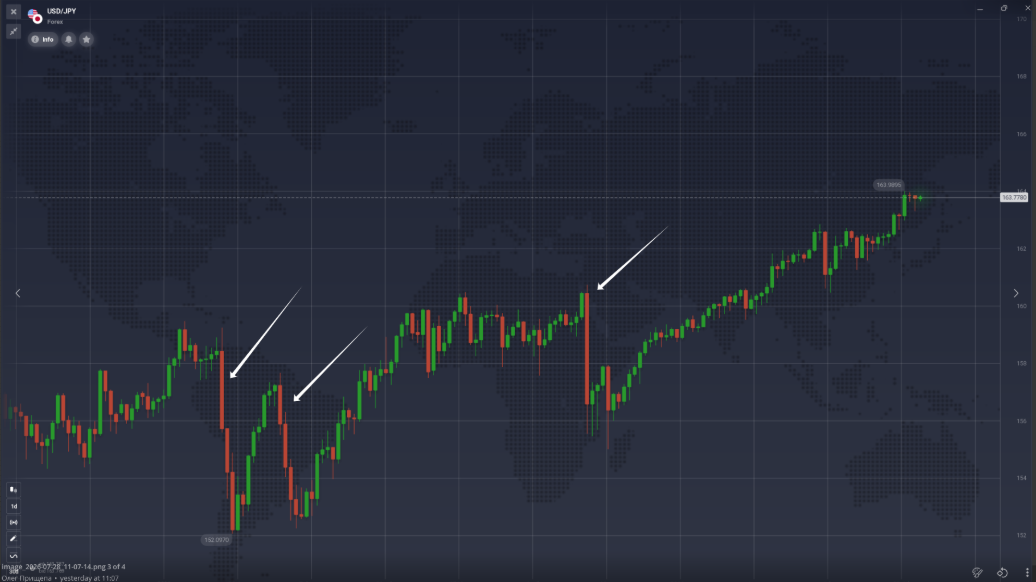
Japanese officials have repeatedly warned they stand ready to intervene, and authorities have already stepped into the market several times during 2026. Yet each intervention has produced the same result: a sharp but short-lived drop in USD/JPY, followed by another steady climb higher.
For newer traders, this raised a question:
If Japan is actively buying its own currency, why does the yen keep weakening? 🤔
The answer lies in the difference between temporary intervention and long-term monetary policy.
Intervention Can Change the Price — But Not the Trend
When a central bank or finance ministry intervenes in the foreign exchange market, it buys or sells its own currency to influence the exchange rate.
In Japan’s case, authorities sell U.S. dollars and buy yen in an effort to slow the currency’s depreciation.
These operations can be extremely powerful in the short term.
Every intervention this year triggered an immediate reversal, with USD/JPY dropping sharply within hours as traders rushed to unwind long-dollar positions. But within days or weeks, buyers returned and the broader uptrend resumed.
Why? Because intervention changes market liquidity, not necessarily market incentives.
As long as investors continue to earn significantly higher returns from holding U.S. dollar assets than Japanese ones, many will keep selling yen regardless of official action.
The Real Driver Is the Interest Rate Gap
The main reason the yen keeps weakening isn’t intervention — it’s the gap between U.S. and Japanese interest rates.
While the Bank of Japan has started moving away from ultra-loose policy, rates in Japan remain far below those in the U.S. That means investors can still earn much higher returns by holding dollar-denominated assets.
This encourages one of the most common strategies in the FX market: the carry trade. Investors borrow cheaply in yen and use those funds to buy higher-yielding assets elsewhere.
As long as that yield gap remains wide, demand for the dollar is likely to stay strong — and so is the pressure on the yen.
The latest rally doesn’t necessarily invalidate that view. Previous interventions have also produced sharp rebounds, only for the yen to weaken again as investors refocused on the wide interest-rate gap between the U.S. and Japan.
“Intervention can trigger violent short-term moves, but it doesn’t necessarily change the long-term narrative,” — says SabioTrade’s expert Oleg Prischepa.
Why Traders Are Becoming Less Sensitive to Intervention Warnings
Another reason the market has continued pushing USD/JPY higher is psychology.
Officials have repeatedly stated they are prepared to take “decisive” or “bold” action if needed, reinforcing that intervention remains on the table. Normally, those warnings alone can discourage speculative positioning. This year, however, traders have become increasingly comfortable testing those limits.
The reason is simple: previous interventions slowed the rally, but they didn’t reverse the underlying trend.
Instead of viewing intervention as the beginning of a sustained reversal, many market participants now see it as a source of temporary volatility within an otherwise bullish USD/JPY environment. Recent analysis suggests the market is becoming less responsive to verbal warnings alone, with traders focusing far more on monetary policy than official rhetoric.
That doesn’t mean intervention has become irrelevant — it means the bar for changing sentiment has become much higher.
Could the Yen Rally Last?
The Bank of Japan meeting has already reminded traders just how quickly sentiment can shift.
The yen rallied sharply after the BoJ struck a more hawkish tone than some investors had expected, fueling speculation that Japan could continue moving away from its ultra-loose monetary policy. The move was amplified by traders rushing to unwind bearish yen positions.
The key question now isn’t whether the BoJ can move the market — it already has. The question is whether this marks the beginning of a lasting trend reversal or simply another short-lived rebound.
Much will depend on what happens next:
- If the Bank of Japan continues tightening policy while the Federal Reserve moves closer to rate cuts, the U.S.-Japan yield gap could narrow further, providing more durable support for the yen.
- If that gap remains wide, the latest rally may prove to be another temporary correction within the broader trend.
JPY Trader’s Watchlist
The next major move in USD/JPY will likely depend on several factors over the coming weeks:
- Government intervention. Another sudden move similar to this week’s rally could create sharp volatility in USD/JPY, even if the longer-term trend remains unchanged.
- Bank of Japan decisions. Even subtle changes in guidance could affect expectations for Japanese yields.
- U.S. Treasury yields. The interest-rate differential remains one of the strongest drivers of the pair.
- Official rhetoric. Markets will watch whether verbal warnings evolve into actual intervention.
- Market positioning. When too many traders crowd into the same carry trade, even a small catalyst can trigger a sharp reversal.
₿ Bitcoin Keeps Testing $60,000.
Here’s Why It Matters
Bitcoin has spent much of July hovering around the $60,000 area — a level that has already held three major sell-offs this year.
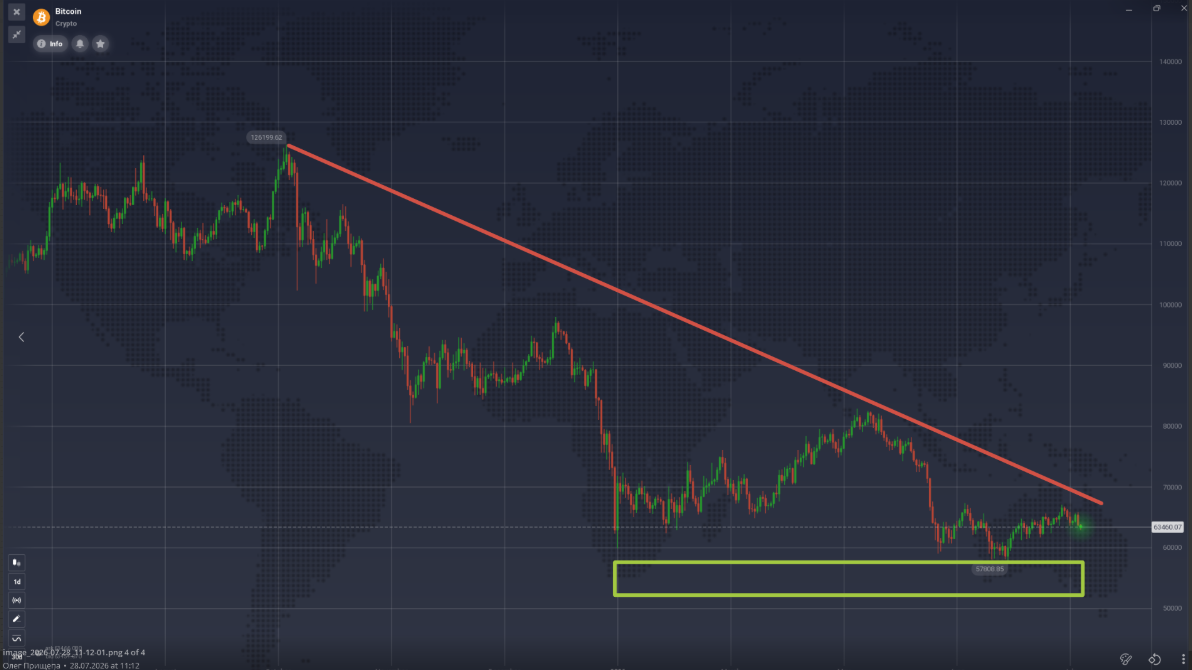
For bulls, it’s a sign that buyers continue to step in whenever Bitcoin approaches this price.
For bears, it’s something else entirely: a support level that grows weaker every time it’s tested.
The bigger picture makes the debate even more interesting.
Despite the recent stabilization, Bitcoin is still trading below the descending trendline that has capped every rally since October 2025. Until that trendline is broken, the broader downtrend technically remains intact.
Why $60,000 Matters
Support levels become important because that’s where buyers have repeatedly entered the market.
Bitcoin bounced from roughly the same area in February, June and now July.
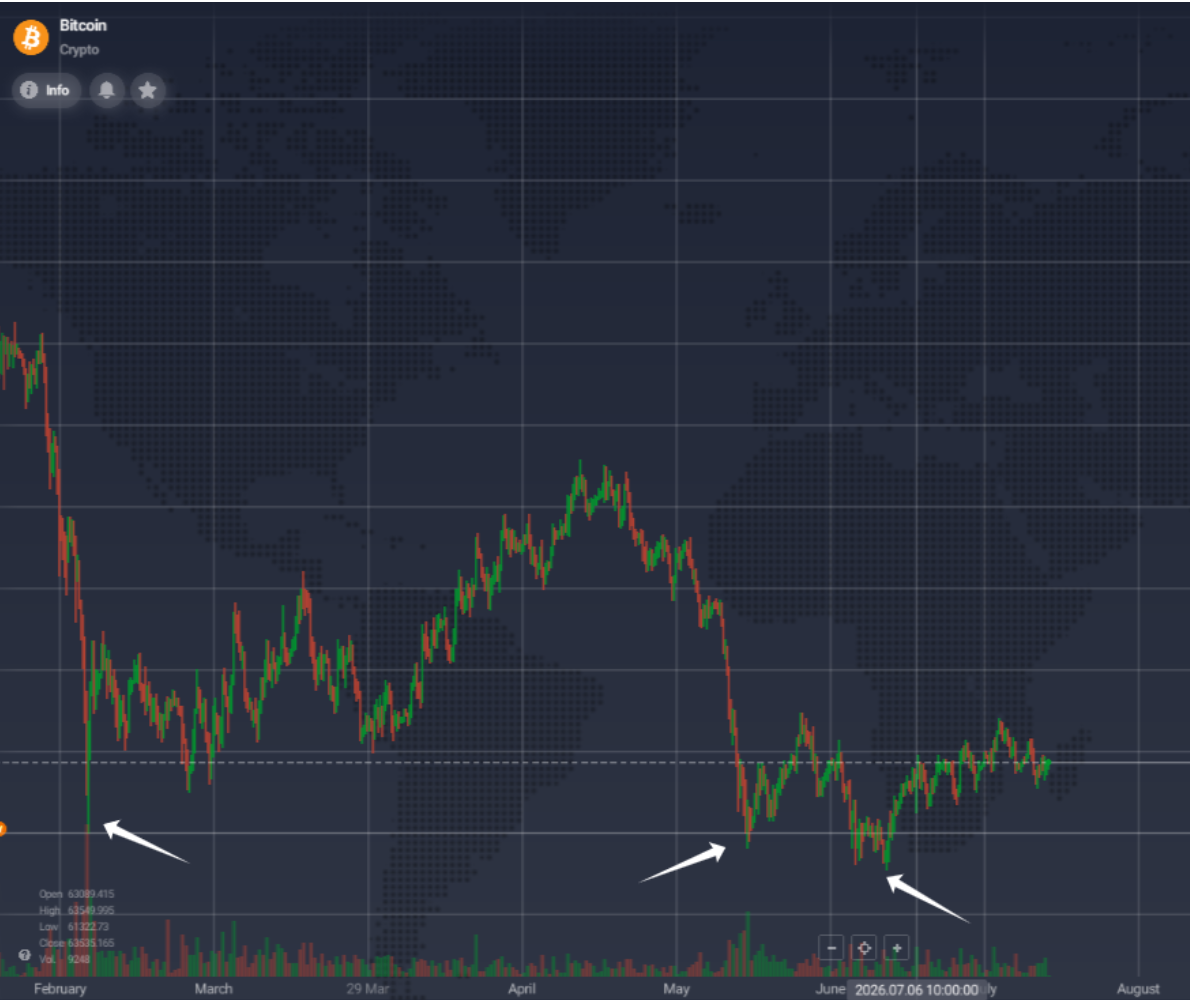
Each rebound suggests demand still exists. But technical analysis also teaches another lesson:
The more often support is tested, the more likely it is to eventually fail.
Every bounce absorbs another wave of buying interest. If sellers continue returning while buyers become exhausted, the next test can produce a much larger move lower.
What Could Trigger a Breakout?
For Bitcoin to convince traders that a new uptrend has begun, holding $60,000 isn’t enough.
The market also needs to:
- break above the descending trendline;
- start making higher highs and higher lows;
- see stronger buying volume;
- attract renewed ETF inflows.
Without those signals, recent price action may simply represent another relief rally inside a broader bear trend.
What Could Send Bitcoin Lower?
The bearish scenario: if $60,000 finally breaks, many traders will likely view it as confirmation that buyers have lost control.
Combined with high interest rates, cautious institutional positioning and continued ETF outflows, that could open the door to another wave of selling.
BTC Trader’s Watchlist
Whether Bitcoin is forming a bottom or preparing for another leg lower will likely depend on a few key signals:
- $60,000 support. A fourth successful defense would reinforce buyers’ conviction. A decisive break could trigger another wave of selling.
- The descending trendline. Bitcoin needs to break above the trendline that has capped every rally since October 2025 to signal a potential trend reversal.
- Spot Bitcoin ETF flows. Sustained inflows would suggest institutional investors are returning. Continued outflows would point to weaker demand.
- Federal Reserve expectations. Any shift toward lower interest rates could improve risk sentiment and support Bitcoin.
- Trading volume. A breakout is far more convincing if it’s backed by strong buying volume rather than light summer trading.
The Bigger Lesson
The Japanese yen and Bitcoin are very different assets, but this month they have something
The yen and Bitcoin may seem like very different markets, but both have spent July testing traders’ assumptions.
The yen showed that government intervention can trigger dramatic short-term reversals without necessarily changing the bigger picture. Bitcoin reminded traders that major support levels often become the market’s main battleground before the next trend emerges.
In both cases, the biggest moves came from understanding why prices were moving. Understanding the forces behind the price action — not just following the news — is what will separate successful traders from the rest this year.
About SabioTrade
SabioTrade provides trading education, market analysis, and trading skill evaluation programs in a simulated trading environment. Its services are designed to help users develop trading discipline and risk management skills under market-like conditions. Participation in any evaluation program is subject to SabioTrade’s terms, conditions, and eligibility requirements.