





Monday’s U.S. ISM Services PMI briefly sent the dollar higher. But the move didn’t last, and the Greenback spent the next hours giving back ground.
See, while the headline reading looked solid enough, the underlying components told a weaker story.
This disconnect is what traders are still trying to sort out.
So What Is the ISM Services PMI, Exactly?
The ISM Services PMI, short for Purchasing Managers’ Index, is a monthly survey of supply executives at U.S. service companies.
At its core, it asks whether business conditions improved or worsened from the previous month. A reading above 50 signals expansion, while anything below 50 points to contraction.
Services make up roughly 70% of the U.S. economy, so the survey offers one of the timeliest snapshots of whether its largest sector is gaining or losing momentum.
September’s headline index came in at 54.9, marking the 27th straight month of expansion. It was close to forecasts and looked reassuring enough at first glance.
But traders often dig deeper into components such as Business Activity, New Orders, Employment, and Prices. Business Activity measures current output, New Orders gauges future demand, Employment tracks hiring, and Prices shows what companies are paying for inputs.
That’s where the September report got messy. Business Activity fell to 56.5, well below the 61.5 forecast and down 5.2 points from August’s 61.7. Meanwhile, the Prices index jumped to 74.0, its highest reading since July 2022 and its sixth reading above 70 in seven months. Fuel costs also rose for an eighth straight month.
So while the headline still pointed to expansion, the details painted a more complicated picture.
Promoted: Trade Beyond the Headline
When the dollar spikes on a headline and reverses as traders dig into the details, disciplined analysis matters. The5ers gives traders access to funded accounts and a scaling path, so they can focus on executing their strategies.
With 10 years in business, a 4.7★ rating from 32K+ reviews, and more than 1.6 million traders worldwide, The5ers offers an established route for traders ready to put their market analysis to work.
Learn more about The5ers and available discounts
Disclosure: We may earn a commission from our partners if you sign up through our links, at no extra cost to you.
The Last Time Prices Were This High
Markets were reminded that the Prices index hasn’t been this high since July 2022, when it reached 74.5 near the peak of the pandemic-driven inflation surge. Back then, the Fed was just getting started with its tightening cycle. Interest rates were still near zero, economic growth was running hot, and policymakers had plenty of room to raise borrowing costs.
September 2026 brings a nearly identical Prices reading, but the backdrop couldn’t be more different. The Fed has already lifted rates to a range of 3.75% to 4.00%, the labor market is cooling, and Business Activity is losing momentum.
So, the inflation pressure looks familiar, but the Fed has far less room to respond.
Why Hot Prices Still Pulled the Dollar Lower
Under normal circumstances, hotter prices point to persistent inflation, which can raise expectations for tighter Fed policy and make dollar-denominated assets more attractive. That’s how the textbook sequence usually works, but the problem wasn’t inflation alone.It was the combination of stubborn price pressure and a sharp slowdown in Business Activity, which leaves the Fed facing an uncomfortable tradeoff.
Another rate hike could help cool the Prices index, but it would also tighten financial conditions just as service sector activity and hiring appear to be losing momentum. Business Activity dropped more than five points in one month, while Friday’s jobs report showed just 29,000 new positions compared with expectations near 90,000. Raising rates into this environment could turn an economic slowdown into something more serious.
Holding rates steady carries its own risks. The Prices index has remained above 60 for 22 straight months, while fuel costs have risen for eight consecutive months. The Fed’s 2026 projection for PCE inflation, its preferred inflation gauge, stands at 3.7%, well above its 2% target. If the Fed leaves rates unchanged while service prices remain this hot, inflation could stay elevated for longer.
Neither choice is especially appealing, but the dollar’s reaction suggests traders were more worried about slowing growth than another Fed hike. This interpretation reduces the likelihood of a near-term rate increase. And when hike expectations fall, the dollar loses some of the yield advantage that has been attracting capital to U.S. assets.
USD 5-minute Forex – Chart Faster with TradingView
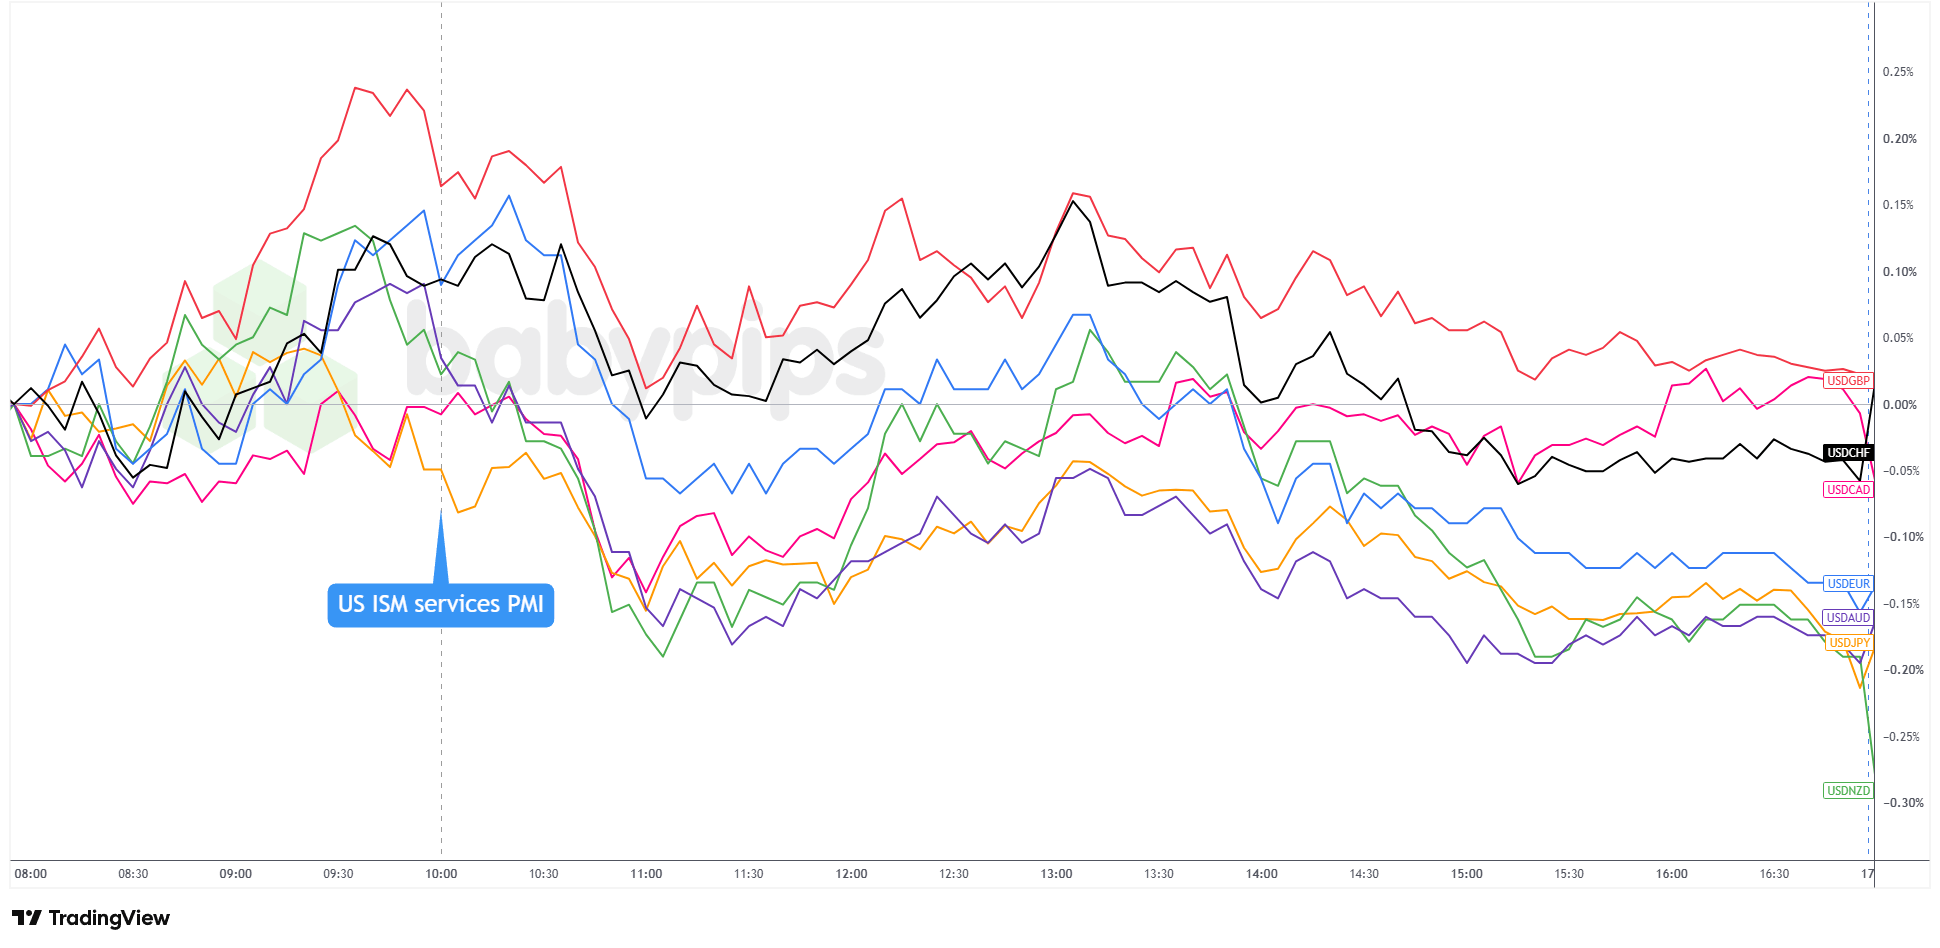
As the 5-minute chart above shows, the dollar initially jumped against currencies such as EUR, AUD, and NZD, likely as traders reacted to a headline reading that came in close to forecasts and still pointed to expansion. But once the weaker details sank in, the move reversed and the selling continued.
By around 5:00 p.m. ET, the dollar was lower against most major currencies. Still, earlier gains during the Asian session helped it finish the day higher against all but the Australian dollar.
What really stood out was the staying power of the dollar’s selloff. A single data release often triggers a sharp move that fades within an hour or two, but this reversal lasted through the session.
This persistence suggests the ISM details reinforced concerns that had already been building since Friday’s jobs miss. After Friday’s NFP miss, CME FedWatch Tool showed markets pricing in roughly 77% odds of an October hold. Monday’s ISM details only strengthened that view.
The Bottom Line
The headline doesn’t tell the whole story. A reading of 54.9 shows that the services sector is still expanding, but it doesn’t reveal that input prices have remained elevated for 22 straight months or that fuel costs have risen for eight months in a row. Those details explain why traders who skimmed the headline on Monday saw a very different report from those who looked under the hood.
Slower growth and hotter prices create a tough problem for the Fed. When inflation is the main concern, the central bank can raise rates to cool demand. But when growth and hiring are already slowing, each additional hike raises the risk of making the downturn worse. September’s data suggests that balancing act is becoming more difficult.
Dollar traders care about what the data means for Fed policy. The ISM Services PMI matters less on its own than as another piece of the interest rate outlook. If the report leads traders to expect fewer hikes, the dollar can lose some of its yield appeal. Monday’s reversal showed that process playing out in real time.
Keep an eye on the Prices streak. The Prices index has remained above 60 for 22 consecutive months. Whether it stays above 70 heading into the fourth quarter could offer an important signal about service sector inflation, especially alongside the next CPI report and the Fed’s latest policy guidance.
What’s Next
U.S. September CPI comes out on October 14. A hot reading would back up the warning from the ISM Prices Index and make the Fed’s job even tougher ahead of its October 28 policy decision. Markets are currently leaning heavily toward a hold, but an upside inflation surprise could quickly bring another hike back into the conversation.
Until then, the ISM Prices index holding above 70 is the key service sector inflation signal to watch.
This article covers how the ISM Services PMI headline sparked a dollar rally that reversed once traders processed the weaker underlying components, and that reaction can seem counterintuitive if you haven’t studied how market expectations drive currency moves. Premium members can read our lesson:
📖 Market Expectations: Why Good News Can Tank a Currency
Reading this helps you understand why currencies move on the deviation from expectations, not just the headline number, how to interpret economic data the way markets actually read it, and why a solid ISM headline can still produce a sustained dollar selloff.
And if you’re not a Premium subscriber yet, now’s a good time to sign up.
With Babypips Premium, you get full access to School of Pipsology lessons that help you understand not just what the data shows, but how markets interpret it and why currencies can move in ways the headline alone never explains.



