


The U.S. services sector kept growing in June, but the pace fell short of what markets expected.
The Institute for Supply Management’s Services PMI came in at 54.0, down from 54.5 in May and below the 54.2 consensus estimate.
The reading kept the sector in expansion for a 24th straight month, and by ISM’s own math, June’s headline number corresponds to a 1.9% annualized increase in real GDP.
Key Takeaways
- Services PMI: 54.0 (expected 54.2, prior 54.5), 24th straight month of expansion
- Business Activity Index: 55.4, down from 57.7 in May
- New Orders Index: 55.1, down from 57.3 in May
- Employment Index: 51.2, up from 47.9, back in expansion after three months of contraction
- Prices Index: 67.7, down from 71.3, its lowest level since February
- Imports Index: 49.4, its first contraction reading in five months
Link to official U.S. ISM services PMI (June 2026)
Business activity and new orders cooled from May, with the Business Activity Index slipping to 55.4 and New Orders falling to 55.1. Employment was the bright spot, rising to 51.2 and ending three straight months of contraction.Prices paid eased for a second month, with the Prices Index down to 67.7. Respondents flagged fewer rising costs, though tariffs and Middle East fuel risks still showed up in the commentary.
Imports fell into contraction for the first time in five months, dropping to 49.4 from 51.1. Backlogs rose to 54.9, their highest since February, suggesting work was still piling up even as growth slowed.
S&P Global’s Composite PMI added to the picture. It was revised down to 51.9 for June, below the 52.2 flash estimate and only slightly above May’s 51.5. Both reports pointed to the same theme: U.S. business activity kept expanding, just not as fast as traders had priced in.
Market Reactions
U.S. Dollar vs. Major Currencies: 5-min
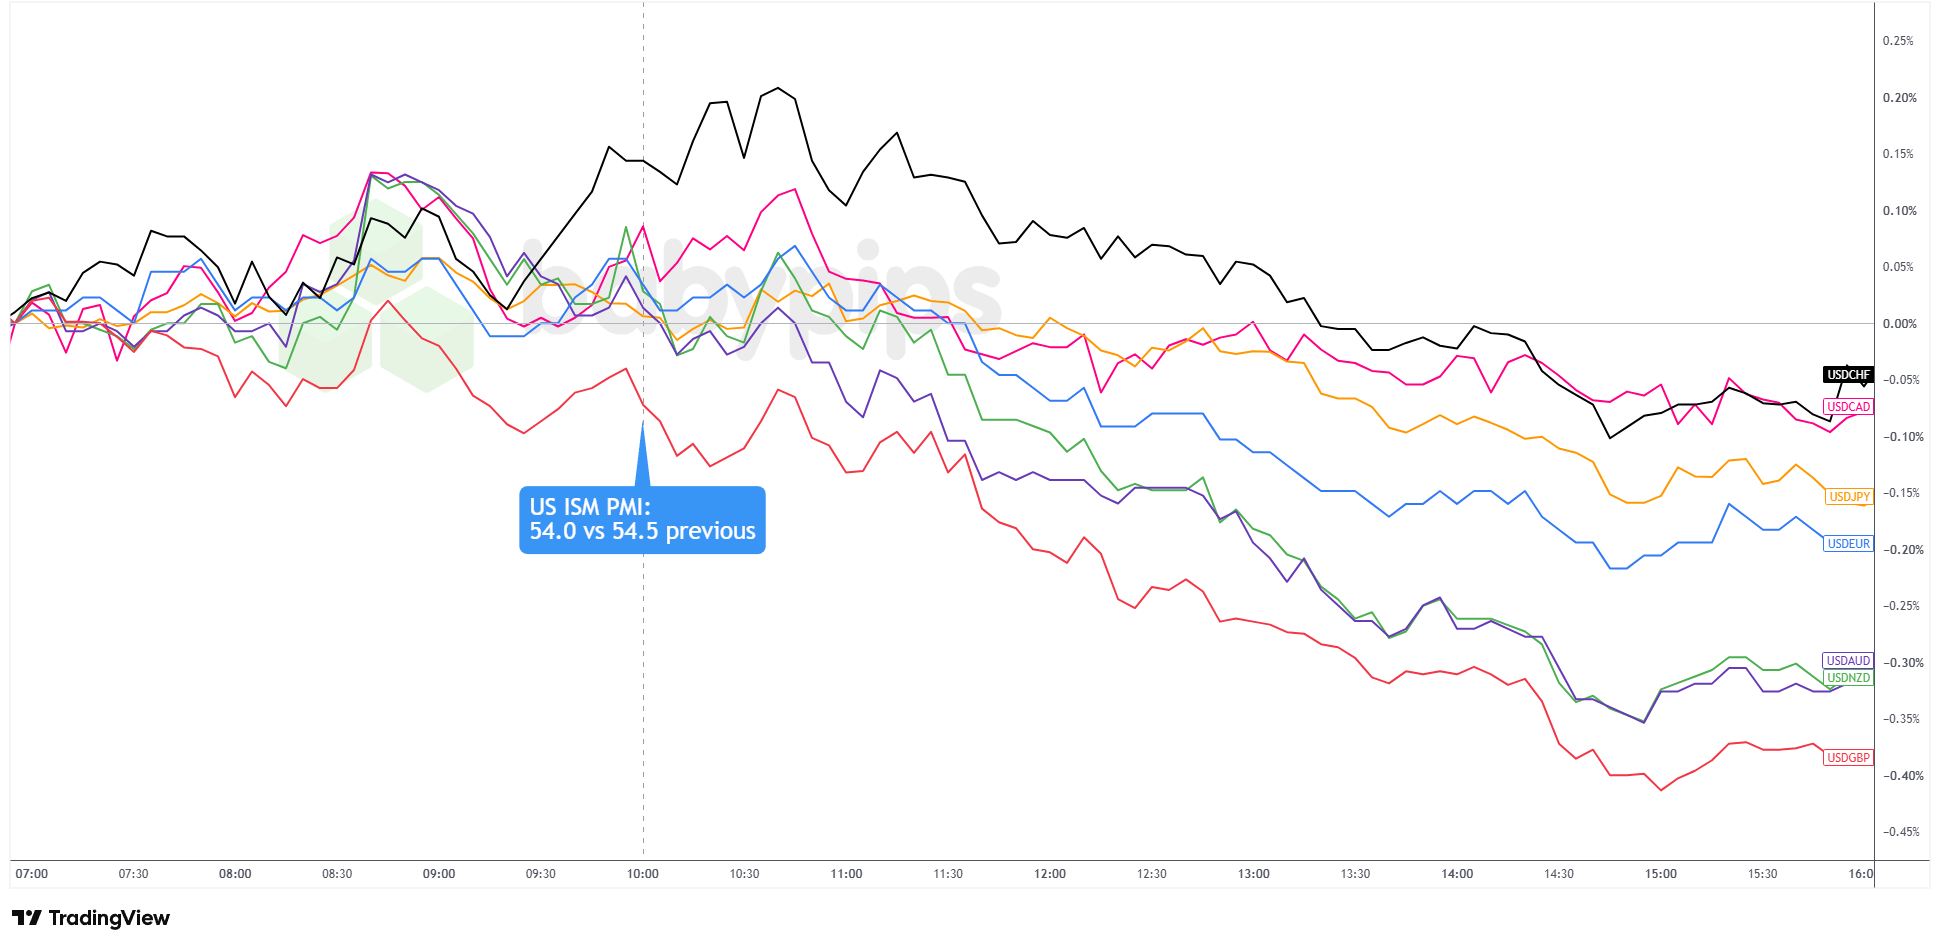
USD 5-minute Forex Chart Faster with TradingView
The dollar had been grinding higher through the New York morning as traders waited on the PMI release. That strength even stretched a little further once the numbers hit the wires, but the miss versus consensus changed the mood pretty quickly. Buyers turned into sellers, and the Greenback spent the rest of the session giving back its earlier gains.
USD/GBP, USD/AUD, and USD/NZD took the biggest hits, sliding from their morning highs to losses of roughly 0.30% by the New York close. USD/EUR gave up a more modest 0.24%, while USD/JPY slipped around 0.10% to 0.15% as the yen caught a bid alongside the broader dollar pullback. USD/CHF and USD/CAD held up better than the rest, fading back toward the flatline into the close after leading the pre-release dollar rally.
The dollar’s performance was mixed by the end of the day, with gains made against JPY, NZD, and CHF even as it lost pips to EUR, AUD, and GBP.
Now the market’s attention turns to this week’s Federal Open Market Committee minutes, the first under new Fed Chair Kevin Warsh. According to CME Group’s FedWatch Tool, markets are pricing in a 25.10% chance of a quarter-point rate hike at the July 28 to 29 meeting, versus a 74.90% chance that the Fed sits tight.
The U.S. ISM Services PMI printed in expansion territory for a 24th straight month, yet the dollar reversed and sold off: that outcome is much easier to read when you understand how currency markets actually respond to economic data releases. Premium members can read our lesson:
📖 Market Expectations: Why Good News Can Tank a Currency
Reading this helps you understand the deviation-from-expectations framework, why a positive headline print can still drive a dollar selloff, and how to interpret market reactions to economic data instead of being caught off guard by them.
And if you’re not a Premium subscriber yet, now might be a good time to sign up.
With Babypips Premium, you get full access to School of Pipsology lessons that help you understand not just what the headline number says, but why currencies move the way they do when economic data hits.



