


U.S. stocks swung between gains and losses on Thursday as Micron’s blowout outlook lifted chipmakers while a slide in Apple and the rest of the megacap group dragged the S&P 500 lower. Hotter inflation data and renewed friction around the Strait of Hormuz drove crude up more than 3%, and the dollar finished as a net underperformer against its major peers.
Check out the forex news and economic updates you may have missed in the latest trading session!
Forex News Headlines & Data:
- BoJ Policy Board member Naoki Tamura delivered a hawkish outlook on the Bank of Japan’s rate path on Thursday; “has a plan in mind” to raise the policy rate by about 0.25 percentage point “once every few months”
-
Australia Employment Change for May 2026: 40.3k (26.0k forecast; -18.6k previous)
- Australia Unemployment Rate for May 2026: 4.4% (4.4% forecast; 4.5% previous)
- Australia Household Spending for May 2026: 5.5% y/y (4.1% y/y forecast; 4.9% y/y previous)
- Japan Leading Indicators Index for April 2026: 116.1 (115.9 forecast; 114.0 previous)
- Germany GfK Consumer Confidence for July 2026: -29.2 (-29.0 forecast; -29.8 previous)
- France Consumer Confidence for June 2026: 84.0 (82.0 forecast; 82.0 previous)
- U.K. CBI Distributive Trades for June 2026: -54.0 (-36.0 forecast; -46.0 previous)
- Canada Average Weekly Earnings for April 2026: 3.8% y/y (2.9% y/y forecast; 3.5% y/y previous)
- U.S. Initial Jobless Claims for June 20, 2026: 215.0k (225.0k forecast; 226.0k previous)
- U.S. Chicago Fed National Activity Index for May 2026: -0.1 (0.12 forecast; 0.14 previous)
- U.S. GDP Growth Rate Final for Q1 2026: 2.1% q/q (1.6% q/q forecast; 0.5% q/q previous)
- U.S. Durable Goods Orders for May 2026: -4.5% m/m (-4.0% m/m forecast; 7.9% m/m previous)
-
U.S. Core PCE Price Index for May 2026: 0.3% m/m (0.2% m/m forecast; 0.2% m/m previous); 3.4% y/y (3.3% y/y forecast; 3.3% y/y previous)
- U.S. Personal Spending for May 2026: 0.7% m/m (0.7% m/m forecast; 0.5% m/m previous)
- U.S. Personal Income for May 2026: 0.7% m/m (0.3% m/m forecast; 0.0% m/m previous)
- U.S. Kansas Fed Manufacturing Index for June 2026: 19.0 (7.0 forecast; 9.0 previous)
Have a solid trading strategy but lack the capital? FundedNext empowers disciplined traders by providing simulated trading accounts up to $200K.
Unlike other prop firms, FundedNext imposes no artificial time limits on challenges. You even earn a unique 15% profit share during your evaluation! Once funded, you keep up to a 95% profit split with guaranteed 24-hour payouts. Trade CFDs or Futures your way—even during major news events.
Join over 400K traders who have received $300M+ in payouts. Ready to back your edge?
Learn More About FundedNext! Limited time offer: Use code BPFN for discounts on both CFD & Futures plans! T&C apply. T&C apply.Disclosure: We may earn a commission from our partners if you sign up through our links, at no extra cost to you.
Broad Market Price Action:
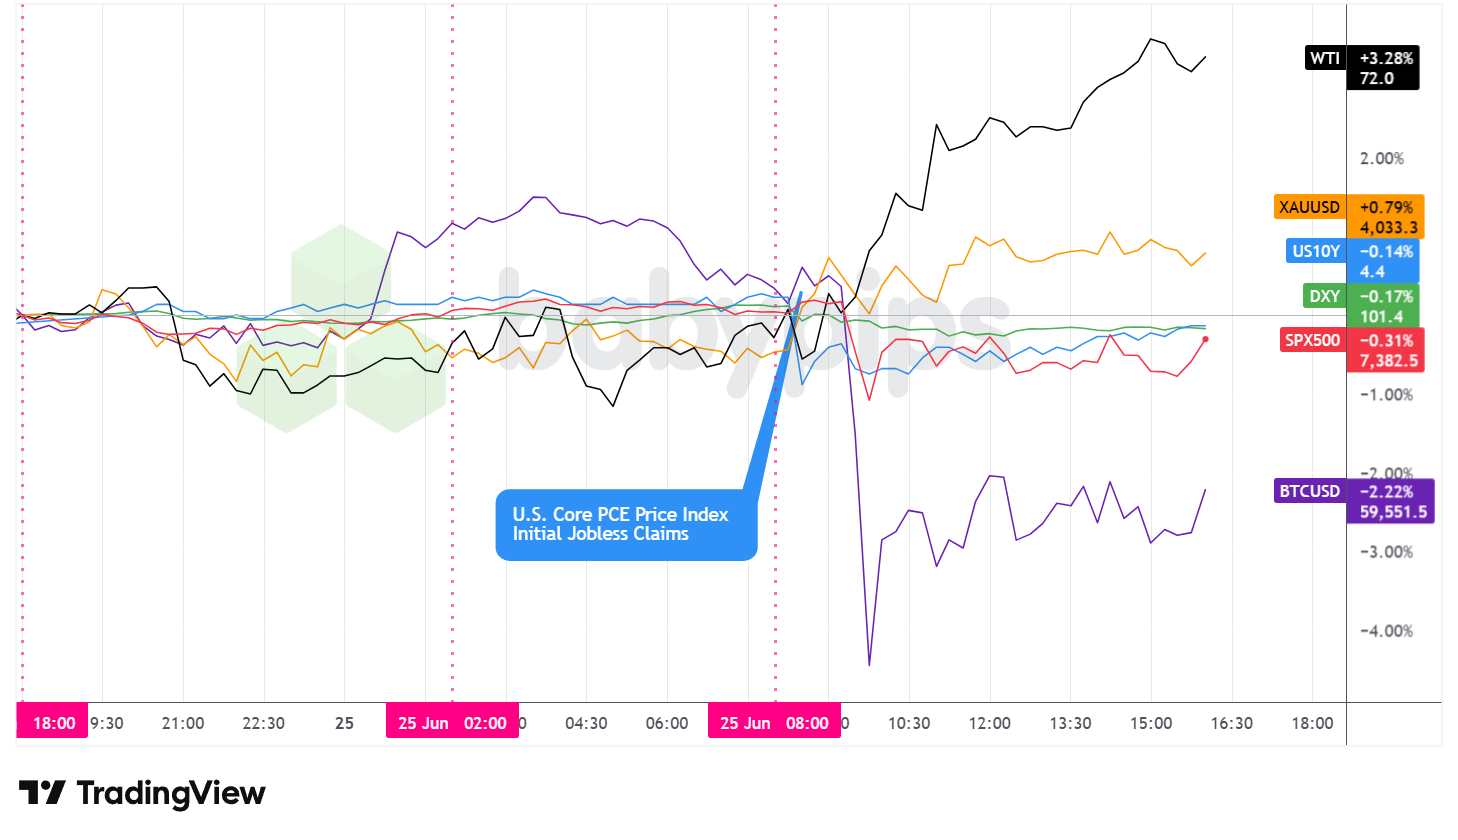
Dollar Index, Gold, Oil, S&P 500, U.S. 10-yr Yield, Bitcoin Overlay – Chart Faster With TradingView
Thursday’s tape split across asset classes as an energy rally, a hotter inflation print, and a rotation inside the equity market pulled in different directions.
WTI crude was the session’s standout, climbing roughly 3.3% to trade near $72 a barrel. The advance lined up with renewed Strait of Hormuz tension, starting with the IRGC Navy’s rejection of the transit framework and followed by reports of a ship struck in the waterway and freighters turning back. Crude had fallen for four straight sessions into Thursday, so part of the move possibly reflected a reversal of that recent weakness.
The S&P 500 swung either side of flat before closing near 7,382, down about 0.3%. Micron’s blowout outlook lifted chipmakers while Apple and the other megacap names sold off, and that split left the index wavering through the U.S. afternoon. The equal-weighted version of the index held up better than the headline gauge, a pattern that points to rotation out of the largest tech winners rather than broad selling.
Gold firmed through the U.S. session to close near $4,033, up around 0.8%. With no single gold-specific catalyst on the tape, the gain possibly reflected safe-haven demand tied to the Hormuz headlines, and likely some weight coming from USD weakness during the US session.
Bitcoin fell hard around the U.S. open, dropping from near $61,000 to a low close to $58,000 before clawing back to settle near $59,550, down roughly 2.2%. The slide tracked the broader bout of volatility in speculative and tech-linked assets and showed little direct link to the day’s data.
The U.S. 10-year Treasury yield eased to around 4.4% and finished little changed on the day. Shorter-dated yields slipped as traders leaned toward the Fed keeping rates on hold, weighing Thursday’s firmer inflation print against signs that the prior stretch of falling energy prices could ease pressure in the months ahead.
Promoted: The Strategy is Half the Battle; Your Mindset is the Rest.
Most trading mistakes aren’t technical—they’re psychological. In the classic “Trading in the Zone” by Mark Douglas (⭐ 4.7★ | 10,000+ reviews on Amazon), you’ll learn how to master the probabilistic thinking and emotional discipline mentioned in today’s article. If you struggle with hesitation or breaking your rules, this is your manual for consistent execution.
Click on the link to learn more about “Trading in the Zone” by Mark Douglas!
Disclosure: To help support our content, we may earn a commission from our partners if you sign up through our links, at no extra cost to you.
FX Market Behavior: U.S. Dollar vs. Majors
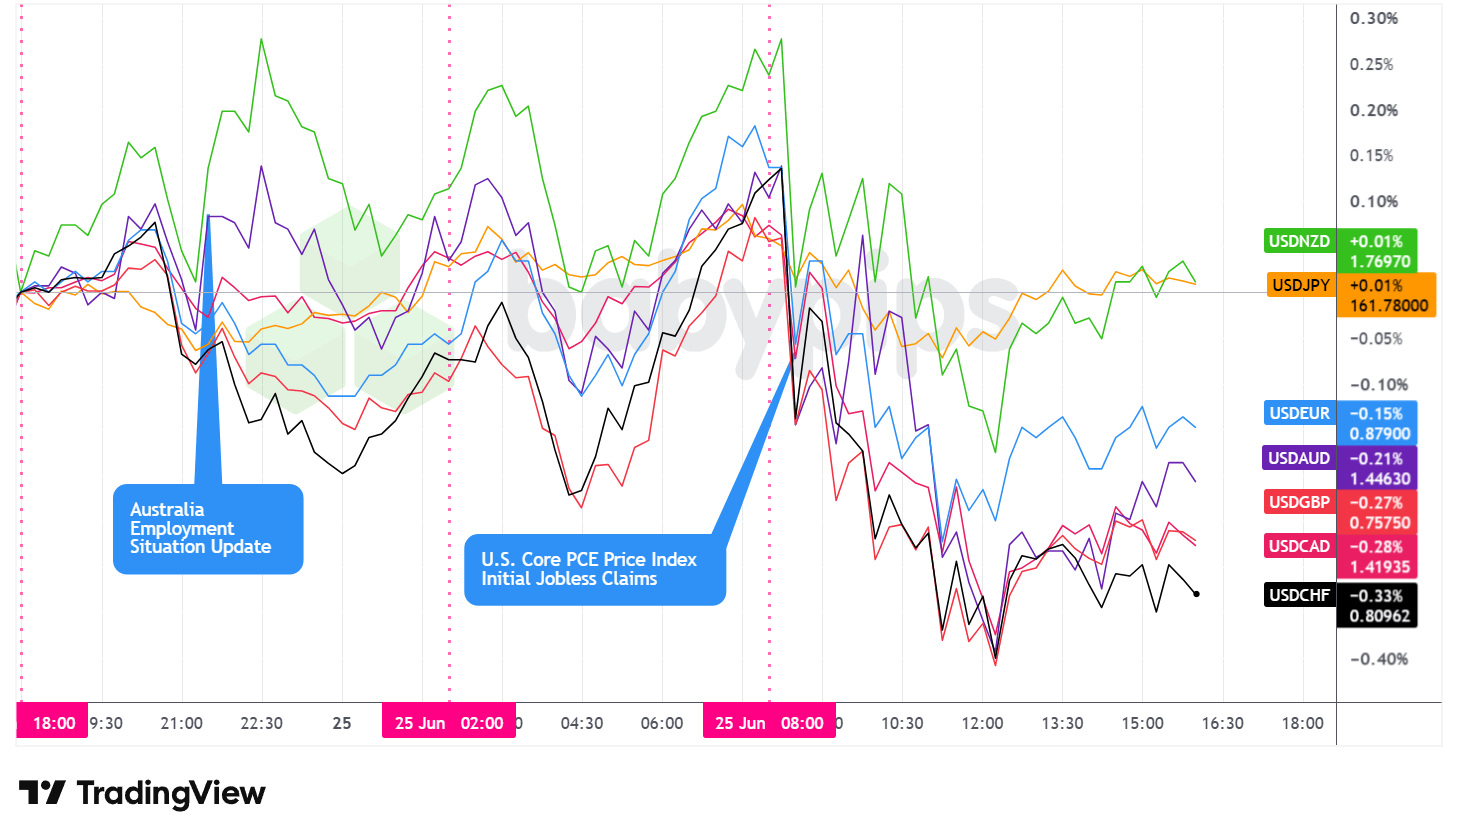
Overlay of USD vs. Majors – Chart Faster With TradingView
The U.S. dollar finished Thursday as a net underperformer, slipping against most of its major counterparts and holding only marginal gains versus the Japanese yen and the New Zealand dollar.
Through the Asian session, the dollar traded sideways and choppy with a net bearish lean. Australia’s May jobs report beat the headline forecast at 40,300 positions added with unemployment back at 4.4%, though a soft April revision and a part-time-heavy mix tempered the read, and the Australian dollar stayed contained on the print.
After the London open, the dollar stayed choppy, bouncing slightly before pulling back through mid-morning, then firming again into the U.S. open. There were no no major data from Europe or news flow, and with U.S. Core PCE data ahead, traders were likely sitting on their hands until the U.S. session. The Dollar Index pushed up to a session high near 101.75 around the start of U.S. trade. With
The 8:30 a.m. ET data landed hotter on inflation, with core PCE rising 0.3% on the month against a 0.2% forecast and personal income and spending both up 0.7%, while initial jobless claims came in lower than expected at 215,000. The dollar spiked lower against the majors for much of the U.S. morning after the release, with the Dollar Index sliding to a midday trough near 101.31. It steadied into the afternoon and recovered a touch to close around 101.41, down about 0.15%.
The greenback’s fall despite hot inflation data figures most likely reflected a buy-the-rumor, sell-the-news reaction, and possibly some profit taking from the strong USD rally that’s been in play since last Wednesday’s hawkish FOMC statement. By the close it sat net lower against most majors, with its only gains, both slim, coming against the yen and the New Zealand dollar.
Promoted: Keep Your Automated Edge Running 24/7.
Your algorithmic strategy shouldn’t rely on your home Wi-Fi. In high-volatility events, execution speed and uptime are what separate a winning backtest from a live market success. ForexVPS provides ultra-low latency, dedicated trading servers that keep your algos executing trades around the clock without interruption. Stop letting connectivity issues erode your edge.
Explore VPS plans at ForexVPS!
Disclosure: To help support our free daily content, we may earn a commission from our partners if you sign up through our links, at no extra cost to you.
Upcoming Potential Catalysts on the Economic Calendar
- Japan Tokyo CPI for June 2026 at 11:30 pm GMT
- Japan Core CPI for June 2026 at 11:30 pm GMT
- France Unemployment Benefit Claims for May 2026 at 10:00 am GMT
- Canada Wholesale Sales Prel for May 2026 at 12:30 pm GMT
- U.S. Wholesale & Retail Inventories Adv for May 2026 at 12:30 pm GMT
- U.S. Goods Trade Balance Adv for May 2026 at 12:30 pm GMT
- UoM U.S. Consumer Sentiment Index & Inflation Expectations (Final) for June 2026 at 2:00 pm GMT
- U.S. Fed Williams Speech at 2:30 pm GMT
- U.S. Fed Kashkari Speech at 3:30 pm GMT
Friday’s calendar leans on U.S. data and Fed commentary. Tokyo CPI carries extra weight after Tamura’s hawkish remarks earlier in the session. A run of Fed speakers, including Williams, Goolsbee, and Kashkari, gives traders a read on how officials weigh Thursday’s firmer core PCE, and the final University of Michigan sentiment survey rounds things out with its closely watched inflation-expectations component.
Stay frosty out there, forex friends!
Geopolitical friction in key shipping lanes can move markets faster than most economic data. Premium members can read our lesson:
📖 Geopolitical Risk, Trade Policy, and Safe Haven Flows
Reading this helps you understand how geopolitical events drive currencies and commodities, which safe havens to watch when tensions spike, and why the dollar’s reaction to hot inflation data can shift when risk sentiment is the stronger force.
And if you’re not a Premium subscriber yet, consider joining.
With Babypips Premium, you get full access to School of Pipsology lessons that help you understand not just what moved the market today, but the macro frameworks and cross-asset relationships that predict tomorrow’s moves before they hit your chart.


