


Markets staged a broad risk-on rally on Monday after the United States and Iran reached an interim peace agreement, with a deal to reopen the Strait of Hormuz sending crude oil sharply lower while equities and cryptocurrencies climbed. The U.S. dollar drifted lower against most major currencies as easing geopolitical tensions trimmed safe-haven demand and nudged Treasury yields down.
Check out the forex news and economic updates you may have missed in the latest trading session!
Forex News Headlines & Data:
- The dominant story of the session was the announcement of an interim peace framework between the United States and Iran. Pakistan’s Prime Minister Shehbaz Sharif first announced the deal, which was subsequently confirmed by both Washington and Tehran, with a formal signing reportedly scheduled in Switzerland for Friday, June 19
- New Zealand Services NZ PSI for May 2026: 47.5 (48.0 forecast; 48.9 previous)
- New Zealand Electronic Retail Card Spending for May 2026: 1.7% m/m (0.4% m/m forecast; -1.3% m/m previous)
- Germany Wholesale Prices for May 2026: 5.9% y/y (7.6% y/y forecast; 6.3% y/y previous)
- Swiss Producer & Import Prices for May 2026: -1.8% y/y (-1.5% y/y forecast; -2.0% y/y previous)
- Swiss Consumer Confidence for May 2026: -38.0 (-41.0 forecast; -40.0 previous)
- Euro area Industrial Production for April 2026: 0.3% (-1.7% forecast; -2.1% previous)
- Euro area Trade Balance for April 2026: -1.0B (12.5B forecast; 7.8B previous)
- Canada Housing Starts for May 2026: 261.4k (260.0k forecast; 279.3k previous)
- Canada Manufacturing Sales Final for April 2026: 4.2% m/m (4.6% m/m forecast; 3.0% m/m previous)
- NY Empire State Manufacturing Index for June 2026: 5.7 (12.0 forecast; 19.6 previous)
- U.S. Manufacturing Production for May 2026: 1.4% y/y (1.7% y/y forecast; 1.3% y/y previous)
- U.S. Industrial Production for May 2026: 1.7% y/y (1.9% y/y forecast; 1.4% y/y previous)
- NAHB U.s.Housing Market Index for June 2026: 35.0 (36.0 forecast; 37.0 previous)
Broad Market Price Action:
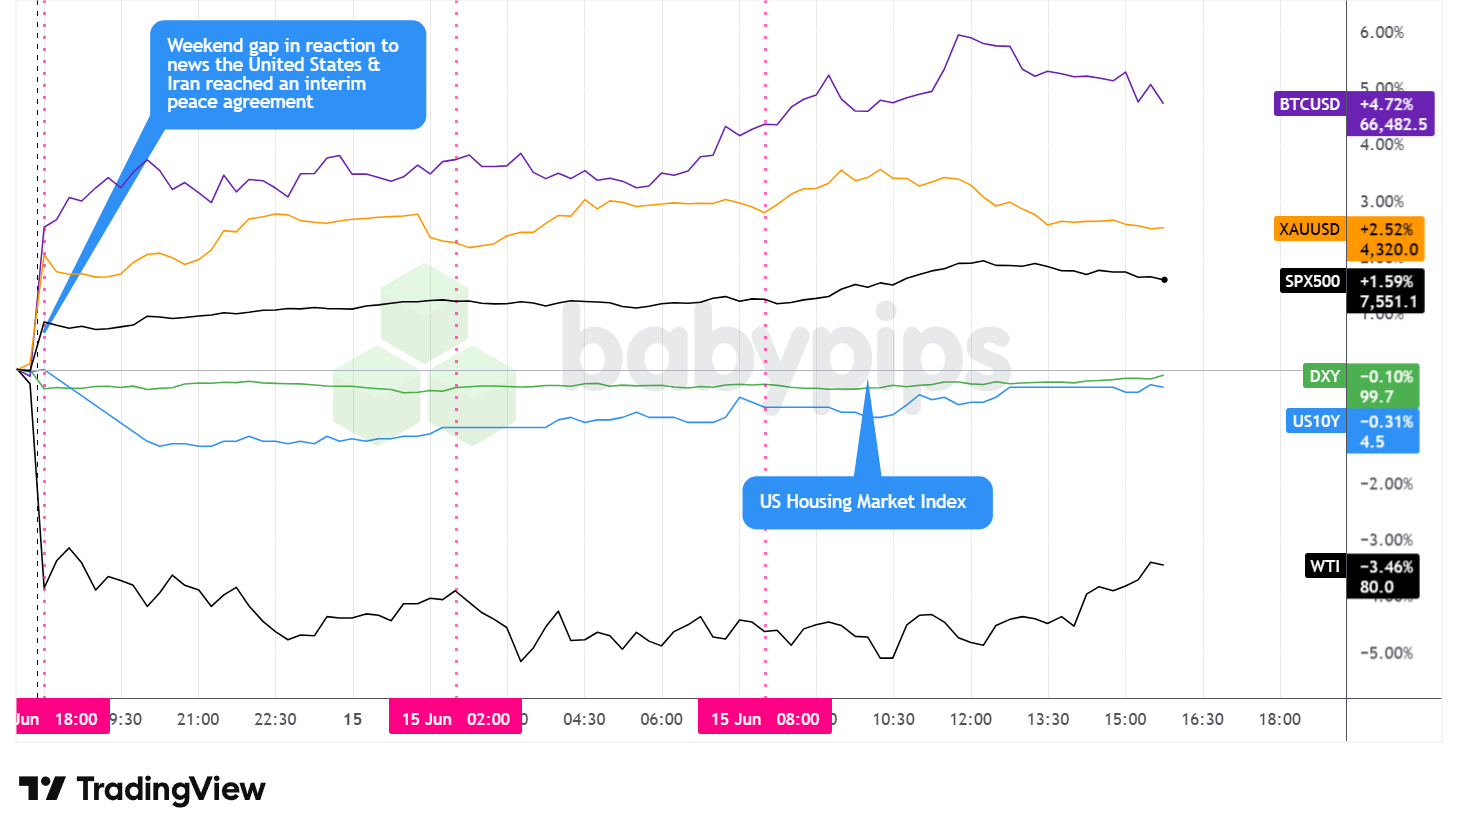
Dollar Index, Gold, Oil, S&P 500, U.S. 10-yr Yield, Bitcoin Overlay – Chart Faster With TradingView
Monday delivered a clear risk-on session as traders priced in a meaningful de-escalation of the conflict that had jolted markets in recent months.
WTI crude oil was the session’s standout loser, falling roughly 3.5% to trade near $80 per barrel. The decline tracked the news that the Strait of Hormuz would reopen, which eases the supply-disruption premium that had been built into prices during the hostilities. Crude gapped lower over the weekend and traded heavily through the Asian and London sessions, dipping toward the $78.50 area at its lows before clawing back part of those losses during the U.S. afternoon. There was no specific catalyst behind the late recovery off the intraday lows, so it likely reflected some position-squaring after a sharp move rather than a fresh fundamental shift.
Equities, by contrast, rallied broadly. The S&P 500 climbed approximately 1.6% to trade near 7,551, building gains steadily through the London and early U.S. sessions to an intraday high in the vicinity of 7,578 around midday before easing modestly into the close. Reporting indicated the advance put the benchmark on track for one of its strongest sessions since April, with the tech-heavy Nasdaq and the Dow showing even stronger relative performance. The move appeared consistent with the broad relief rally and a rotation into economically sensitive sectors as war-related uncertainty receded.
Bitcoin joined the risk-on tone, rising roughly 4.7% to trade near $66,500 and posting the best performance among the major assets tracked. The cryptocurrency gapped higher over the weekend on the agreement news, pushed to an intraday peak in the vicinity of $67,260 around midday, then drifted lower into the afternoon. The strength looked broadly aligned with the improvement in overall risk appetite.
Gold also advanced, gaining approximately 2.5% to trade near $4,320, a notable move given the otherwise risk-positive backdrop. The advance may reflect a softer U.S. dollar, alongside a structural demand story out of Asia: Singapore reportedly removed its 5% cap on physical precious metals investment for eligible funds and family offices, a development that could unlock additional institutional demand. Bullion peaked around $4,370 late in the morning before paring some of those gains into the close.
The U.S. 10-year Treasury yield eased modestly, ending near 4.5%. The move lower appeared to correlate with receding bets on Federal Reserve rate hikes, as the prospect of an end to the war and a pullback in oil prices helped soften near-term inflation concerns.
Promoted: Profitable Trading Isn’t Reserved for Wall Street.
Most traders quietly wonder if consistent profitability is actually achievable for someone like them—or if it’s just a story people tell. Jack Schwager’s newest book, “Market Wizards: The Next Generation,” answers that question directly. The legendary author behind the original Market Wizards series interviews a new generation of successful traders—many self-taught—who built real wealth and income through the markets. Their common thread isn’t genius or insider access. It’s a deliberate process, disciplined risk management, and the conviction to take trading seriously as a pursuit worth mastering.
If that sounds like something worth exploring, this is a good place to start.
Get Market Wizards: The Next Generation on Amazon!
Disclosure: We may earn a commission from our partners if you sign up through our links, at no extra cost to you.
FX Market Behavior: U.S. Dollar vs. Majors
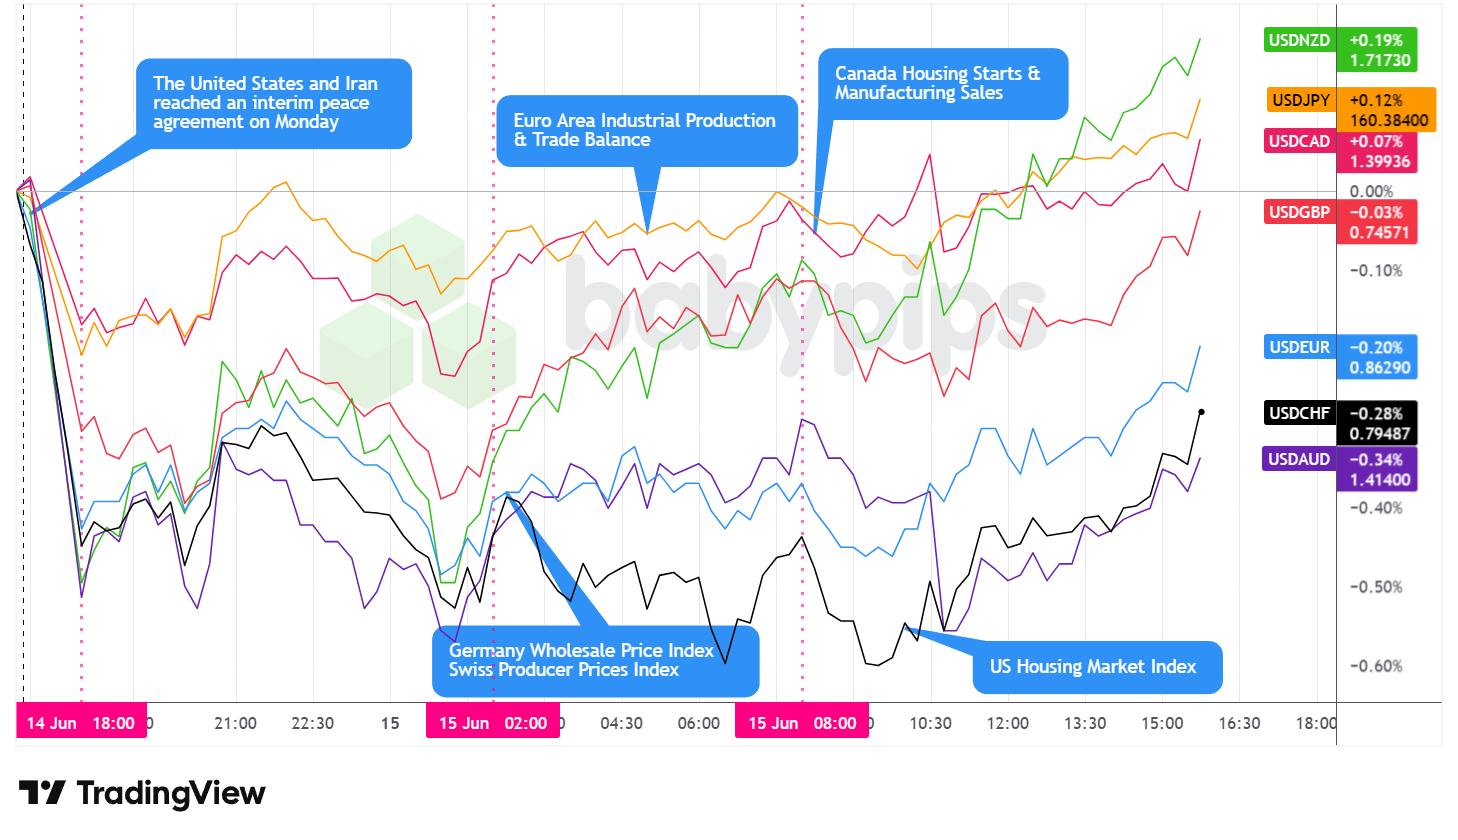
Overlay of USD vs. Majors – Chart Faster With TradingView
The U.S. dollar traded mixed against the major currencies on Monday, closing with an arguably net bearish lean on the day as easing geopolitical tensions appeared to reduce safe-haven demand for the greenback.
At the Asian open, the dollar fell immediately against the majors, likely in reaction to news of a potential deal closing between the United States and Iran. It then saw choppy price action through the rest of the Asian session, arguably leaning net bearish heading into the London open.
During the London morning session, the dollar reversed course and traded net higher against the major currencies, carrying a net bullish lean into the U.S. session open. European data was mixed over the window, with euro area industrial production surprising to the upside while the bloc’s trade balance swung to a deficit, though neither release appeared to drive decisive directional momentum on its own.
During the U.S. session, the dollar pulled back, stabilized, and then rebounded slightly into the afternoon. The domestic data flow leaned soft, with the NY Empire State Manufacturing Index missing sharply, industrial production coming in roughly flat, and the NAHB housing index easing, a backdrop that offered the greenback little fundamental support even as it firmed modestly late in the day.
At the Monday close, the dollar was mixed but arguably net bearish overall. It held up best against the New Zealand dollar and the Japanese yen, with the yen notably pinned near the 160.00 area ahead of the Bank of Japan’s policy decision later, while the greenback was softest against the Australian dollar, the Swiss franc, and the euro.
Promoted: Day traders & Scalpers have better odds of making great decisions if they see market catalysts right away. Get the real-time feed that pros use to catch the news.
Join FinancialJuice for Free to learn more!
Disclosure: We may earn a commission from our partners if you sign up through our links, at no extra cost to you.
Upcoming Potential Catalysts on the Economic Calendar
- New Zealand Food Price Index for May 2026 at 10:45 pm GMT
- China Unemployment Rate for May 2026 at 2:00 am GMT
- China Retail Sales for May 2026 at 2:00 am GMT
- China Industrial Production for May 2026 at 2:00 am GMT
- Bank of Japan Interest Rate Decision for June 16, 2026 at 3:00 am GMT
-
Reserve Bank of Australia Interest Rate Decision for June 16, 2026 at 4:30 am GMT
- Australia RBA Press Conference at 5:30 am GMT
- Germany ZEW Economic Sentiment Index for June 2026 at 9:00 am GMT
- Euro area Labour Cost Index Final for March 31, 2026 at 9:00 am GMT
- Euro area ZEW Economic Sentiment Index for June 2026 at 9:00 am GMT
- Euro area Wage Growth for March 31, 2026 at 9:00 am GMT
- U.S. ADP Employment Change Weekly for May 30, 2026 at 12:15 pm GMT
- Canada Foreign Securities Purchases for April 2026 at 12:30 pm GMT
- U.S. NY Fed Services Activity Index for June 2026 at 12:30 pm GMT
- U.S. Building Permits Prel for May 2026 at 12:30 pm GMT
- U.S. Import & Export Prices for May 2026 at 12:30 pm GMT
- New Zealand Global Dairy Trade Price Index for June 16, 2026
- European Central Bank Lane Speech at 1:10 pm GMT
- U.S. API Crude Oil Stock Change for June 12, 2026 at 8:30 pm GMT
Tuesday’s calendar is front-loaded with central bank risk in the Asian session, headlined by back-to-back policy decisions from the Bank of Japan and the Reserve Bank of Australia, both of which could drive sharp moves in the yen and Aussie. A heavy slate of Chinese activity data lands beforehand and may set the tone for risk sentiment across the region. In Europe, the ZEW sentiment surveys will offer a read on how the easing geopolitical backdrop is filtering into business and investor confidence, while the U.S. session brings a cluster of second-tier data and another ECB speaker in Lane.
Stay frosty out there, forex friends!
Thursday’s dramatic intraday reversal shows what happens when geopolitical headlines shift safe-haven positioning in a matter of hours. Premium members can read our lesson:
📖 Geopolitical Risk, Trade Policy, and Safe Haven Flows
Reading this helps you understand how geopolitical announcements trigger immediate currency repricing, which safe-haven currencies to watch when risk sentiment shifts, and why the dollar doesn’t always move the way you’d expect when market mood changes.
And if you’re not a Premium subscriber yet, now’s a good time to sign up.
With Babypips Premium, you get full access to School of Pipsology lessons that help you understand not just what the headlines say, but how they move currencies, which safe havens traders rotate into, and why the same geopolitical event creates opposite effects on different currencies.


