


Reassurances from Washington that the US-Iran ceasefire remains in place drove a decisive shift toward risk-on sentiment on Tuesday, lifting the S&P 500 to fresh all-time highs while crude oil reversed most of Monday’s war-premium advance. The dollar traded choppy throughout the session, closing mixed but with a net bearish lean overall as losses against the euro, pound, franc, and Australian dollar outweighed a clear gain against the Japanese yen.
Check out the forex news and economic updates you may have missed in the latest trading session!
Forex News Headlines & Data:
- Australia S&P Global Services PMI Final for April 2026: 50.7 (50.3 forecast; 46.3 previous)
- Australia Household Spending for March 2026: 6.3% y/y (5.1% y/y forecast; 4.6% y/y previous)
- Reserve Bank of Australia Raises Cash Rate to 4.35% for a Third Straight Time
- Swiss CPI Growth Rate for April 2026: 0.6% y/y (0.8% y/y forecast; 0.3% y/y previous)
- Canada Balance of Trade for March 2026: 1.78B (-3.4B forecast; -5.74B previous)
- U.S. Building Permits Final for March 2026: -11.4% m/m (11.0% m/m previous)
- U.S. Balance of Trade for March 2026: -60.3B (-61.4B forecast; -57.3B previous)
- Canada S&P Global Services PMI for April 2026: 49.2 (47.6 forecast; 47.2 previous)
- U.S. S&P Global Services PMI Final for April 2026: 51.0 (51.3 forecast; 49.8 previous)
-
U.S. ISM Services PMI for April 2026: 53.6 (53.7 forecast; 54.0 previous)
- U.S. ISM Services Employment for April 2026: 48.0 (45.0 forecast; 45.2 previous)
- U.S. ISM Services New Orders for April 2026: 53.5 (60.0 forecast; 60.6 previous)
- U.S. ISM Services Business Activity for April 2026: 55.9 (53.5 forecast; 53.9 previous)
- U.S. ISM Services Prices for April 2026: 70.7 (71.0 forecast; 70.7 previous)
- U.S. JOLTs Job Quits for March 2026: 3.17M (2.95M forecast; 2.97M previous)
- U.S. JOLTs Job Openings for March 2026: 6.87M (6.9M forecast; 6.88M previous)
- U.S. New Home Sales for March 2026: 7.4% m/m (4.9% m/m forecast; -17.6% m/m previous)
- New Zealand Global Dairy Trade Price Index for May 5, 2026: 1.5% (-2.7% previous)
- ECB Governing Council member Francois Villeroy de Galhau said on Tuesday that he doesn’t see enough to warrant rate hikes
Promoted: Day traders & Scalpers have better odds of making great decisions if they see market catalysts right away. Get the real-time feed that pros use to catch the news.
Join FinancialJuice for Free to learn more!
Disclosure: We may earn a commission from our partners if you sign up through our links, at no extra cost to you.
Broad Market Price Action:
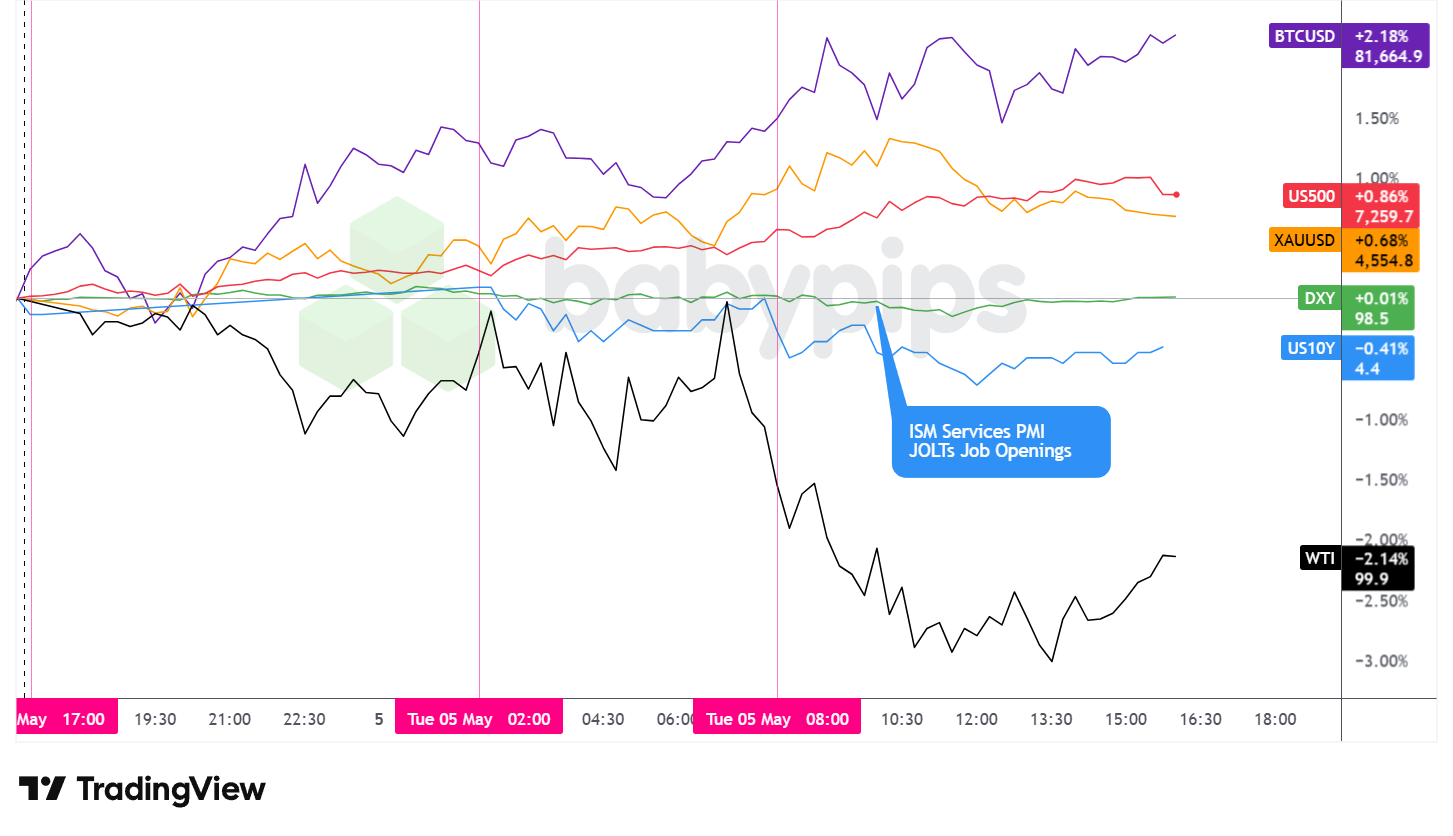
Dollar Index, Gold, Oil, S&P 500, U.S. 10-yr Yield, Bitcoin Overlay – Chart Faster With TradingView
Tuesday’s session was defined by a shift away from Monday’s escalation-driven anxiety. At a Pentagon briefing, Defense Secretary Pete Hegseth and Joint Chiefs Chairman General Dan Caine both confirmed the US-Iran ceasefire, now roughly one month old, remains in place. Secretary of State Marco Rubio described “Project Freedom,” the U.S. military operation escorting commercial vessels through the Strait of Hormuz, as strictly defensive, noting that American forces would fire only if fired upon. Those assurances helped unwind some of the prior session’s fear-driven positioning, with equities rallying to records while crude oil reversed lower.
WTI crude oil was the session’s standout underperformer, falling 2.19% to settle near $99.75 per barrel, pulling back from Monday’s sharp advance. Today’s price action showed crude trading in a relatively tight band around $101 to $102 through the Asian session, spiking briefly during the early London hours before dropping decisively at the New York open to below $100, touching an intraday low near $98.69 before partially recovering into the close. The reversal appeared to coincide with the Pentagon’s reassurances, though crude remains meaningfully elevated relative to pre-conflict levels.
The S&P 500 rose 0.86% to close at approximately 7,261, notching a fresh all-time high. The index climbed steadily from the New York open and advanced throughout the U.S. session, supported in part by a broad technology rally, with chipmakers reaching record levels. Oil weakness and ceasefire stability were likely bullish drivers as well on the day.
Gold gained 0.75% to settle near $4,555 per ounce. The precious metal climbed steadily from Asia through the early U.S. session, reaching an intraday high near $4,587 around the New York open before pulling back through the afternoon. The modest daily gain, even as immediate escalation fears eased, likely reflects recent sentiment that gold has been moving on USD strength and weakness more than geopolitical risk drivers.
Bitcoin advanced 2.01% to trade near $81,719, the session’s strongest performer among the major assets tracked here. The cryptocurrency gained during both the Asian session and again at the New York open, broadly tracking the improvement in risk sentiment.
The U.S. 10-year Treasury yield declined to approximately 4.416%, per the individual chart. Yields drifted lower through Asia and London, then dropped more visibly around 10:00 AM ET when the ISM Services PMI and JOLTs job openings were released simultaneously. The ISM headline came in at 53.6, a touch below the 53.7 forecast and down from March’s 54.0, with the New Orders subindex registering a sharp 7.1-percentage-point decline to 53.5 from 60.6 in March.
Job openings were little changed at 6.87M, slightly below the 6.9M forecast. The bond market’s modest rally alongside rising equities may reflect a soft-landing reading of the data, with the cooling in orders growth possibly reducing near-term inflation pressure fears without signaling a broader contraction. The ISM Prices index held firm at 70.7%, tied for its highest reading since October 2022, a signal that inflation pressures in the services sector remain elevated.
Promoted: As Bitcoin moves higher, professional traders are moving beyond simple exchanges.
With Coinbase, you can manage your BTC positions, stocks and your prediction market positions in one unified, regulated interface. Whether you’re hedging with USDC or eyeing the resistance to break, get the tools you need for the “Everything Exchange” era. Explore Coinbase Now!
Disclosure: To help support our free daily content, we may earn a commission from our partners if you sign up through our links, at no extra cost to you.
FX Market Behavior: U.S. Dollar vs. Majors
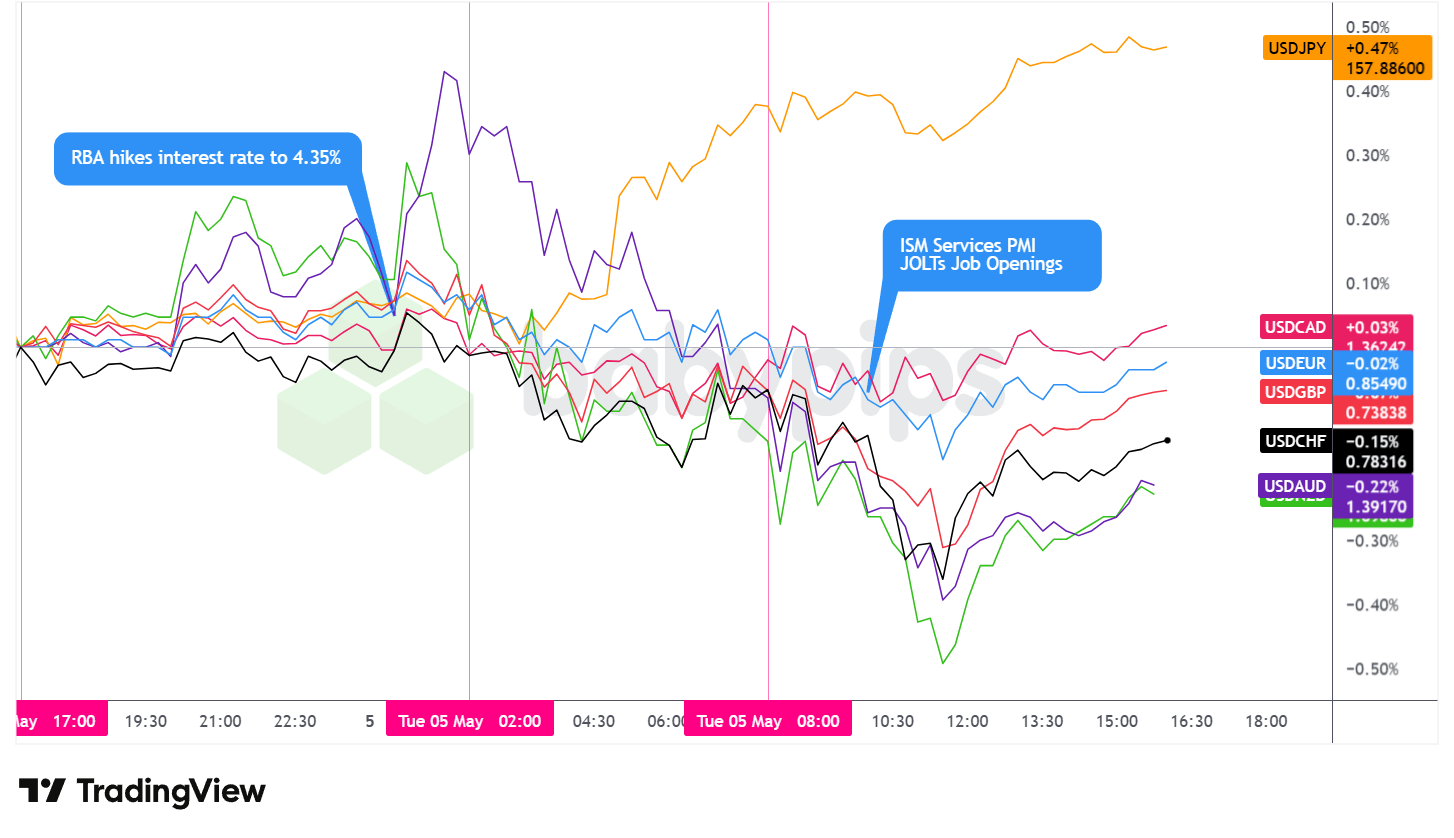
Overlay of USD vs. Majors – Chart Faster With TradingView
The U.S. dollar traded choppy throughout Tuesday’s session, closing mixed against the major currencies. Though the greenback posted a clear gain against the Japanese yen, losses against the euro, pound, Swiss franc, and Australian dollar give the overall daily picture a net bearish lean.
During the Asian session, the dollar traded choppy but net higher. Liquidity was thinner than usual, with public holidays in Japan and mainland China reducing participation and keeping major pairs in narrow ranges. The DXY gradually rose from around 98.27 to a session peak near 98.58 by the time the London session got underway. USDJPY continued to drift higher as the yen extended its recent slide, eventually breaking out of a range that had been capped by prior intervention levels.
The London session brought a net bearish shift for the dollar. The most notable monetary policy event was the RBA’s decision to raise its cash rate by 25 basis points to 4.35%, which matched market expectations, but Governor Bullock’s accompanying press conference language struck a notably neutral tone. With the board signaling it has “space to sit and see what happens” amid the ongoing geopolitical situation, hawkish bets were pared and the next expected hike was pushed out to September at the earliest.
Swiss April CPI came in at 0.6% y/y against an 0.8% forecast, with the core measure also softening to 0.3%, though the SNB is widely expected to look through the current energy-driven supply shock given the nature of the price pressures.
During the U.S. session, the dollar drifted lower initially but broadly recovered after the London close. The 10:00 AM ET data slate, including the ISM Services PMI at 53.6 and JOLTs job openings at 6.87M, came in marginally below expectations but did not produce a decisive directional break.
Promoted: Scale As Market Volatility Spikes, Stability in Your Funding Partner Matters Most.
Navigating the current shift toward risk-on sentiment and record-breaking equities requires more than just a good entry—it requires a partner that has seen it all before.While new firms come and go with the volatility, The5ers has spent the last 10 years perfecting a funding model that works for the trader. It’s why over 262K funded traders worldwide trust them to provide the capital and scaling needed to turn market analysis into meaningful professional growth.
Learn more about The5ers Disclosure: We may earn a commission from our partners if you sign up through our links, at no extra cost to you.
Upcoming Potential Catalysts on the Economic Calendar
- U.S. API Crude Oil Stock Change for May 1, 2026 at 8:30 pm GMT
- New Zealand RBNZ Financial Stability Report at 9:00 pm GMT
- New Zealand Employment Situation Update for March 31, 2026 at 10:45 pm GMT
- Australia AIG Manufacturing Index for April 2026 at 11:00 pm GMT
- China RatingDog Services PMI for April 2026 at 1:45 am GMT
- Germany S&P Global Services PMI Final for April 2026 at 7:55 am GMT
- Euro area S&P Global Services PMI Final for April 2026 at 8:00 am GMT
- Euro area ECB Lane Speech at 8:00 am GMT
- U.K. S&P Global Services PMI Final for April 2026 at 8:30 am GMT
- Euro area PPI for March 2026 at 9:00 am GMT
- U.S. MBA Mortgage Rate & Applications for May 1, 2026 at 11:00 am GMT
- U.S. ADP National Employment Report for April 2026 at 12:15 pm GMT
- U.S. Fed Musalem Speech at 1:30 pm GMT
- Canada Ivey PMI for April 2026 at 2:00 pm GMT
- EIA Crude Oil Stocks Change for May 1, 2026 at 2:30 pm GMT
- U.S. Fed Goolsbee Speech at 5:00 pm GMT
- U.S. Fed Hammack Speech at 5:30 pm GMT
Wednesday’s calendar features the U.S. ADP National Employment Report for April, which will be closely watched as an early read on labor market momentum ahead of Friday’s official payrolls data.
Three Fed speakers, Musalem, Goolsbee, and Hammack, are scheduled, and their commentary will likely be parsed for any signal on how the committee is weighing still-elevated services inflation against the notable cooldown in ISM New Orders.
In energy markets, the EIA crude oil stocks report will carry extra sensitivity given ongoing Strait of Hormuz supply disruptions. Final services PMI prints from Germany, the eurozone, and the UK will provide a broader picture of global demand conditions, while ECB Chief Economist Lane’s speech may add to the context following President Lagarde’s appearance on Tuesday.
Stay frosty out there, forex friends!
Crude oil was Tuesday’s standout mover, falling 2.19% as geopolitical fears unwound, and if you’re not sure how a drop like that feeds into currency pairs like USD/CAD or CAD/JPY, Premium members can read our lesson:
📖 How Oil Moves with USD/CAD, USD/NOK, and CAD/JPY
Reading this helps you understand why oil price swings move specific currency pairs, how each pair reacts differently to the same crude move, and how to use those relationships to confirm or filter trade setups when energy markets are in play.
And if you’re not a Premium subscriber yet, consider joining.
With Babypips Premium, you get full access to School of Pipsology lessons that help you understand not just that oil moved today, but which currency pairs felt it, why each one reacted differently, and how to trade around energy-driven moves with more context and confidence.


