





Inflation didn’t budge in July, as the Federal Reserve’s preferred inflation gauge held at 3.3% year-over-year, well above the Fed’s 2% target.
Add in a Q2 GDP reading that confirmed the U.S. economy grew 1.5%, and you get a Federal Reserve stuck between two uncomfortable choices.
Here’s what the core PCE price index and Q2 GDP estimate imply for Fed policy, dollar direction, and Warsh’s upcoming Jackson Hole testimony.
What Actually Happened?
Two reports landed Wednesday morning, both from the same government agency, both watched closely by anyone trading the U.S. Dollar (USD).
First, the Bureau of Economic Analysis (BEA) released July’s Personal Income and Outlays report. Annual inflation in the United States, as measured by the change in the Personal Consumption Expenditures Price Index, remained unchanged at 3.7%, topping the 3.6% forecast.
The core PCE Price Index held steady at 3.3%, matching expectations. On a monthly basis, both the headline and core PCE Price Index rose 0.2%.PCE measures what Americans actually spent money on last month, and its “core” version strips out food and energy because gas and grocery prices swing too much month to month to reveal a clean trend.
Second, the BEA released its second estimate of Q2 GDP. Real GDP increased at an annual rate of 1.5% in the second quarter, unchanged from the advance estimate, down from 2.1% in the first quarter.
GDP measures the total value of everything the economy produced. Consumer spending, exports, and investment drove the gain. Government spending pulled the other way.
Put all these together, and you get a two-part X-ray: how fast the economy is growing, and how much prices are still rising while it does.
How Did This Happen?
Inflation staying at 3.3% isn’t really “news” in the traditional sense. It’s more like a stuck door that refuses to budge no matter how many times you push on it.
A few forces likely kept the pressure on: Tariff-related costs appear to be filtering through supply chains slower than initially expected, which may be one reason core goods and services prices haven’t cooled the way many economists hoped earlier this year.
In addition, energy prices actually fell during the month, with goods prices up 1.3% year-over-year after declining 0.6% on a monthly basis, while services prices climbed 2.5% year-over-year. Services inflation tends to be stickier because it’s driven by wages and rent, both of which move slowly.
Personal income also grew faster than spending. Personal income rose 0.4% while spending increased 0.2%, both stronger than economists expected. That combination matters. When income outpaces spending, households build savings rather than draw them down, which suggests underlying demand hasn’t cracked even with rates sitting at elevated levels.
Sticky inflation combined with resilient growth is exactly the kind of data that could keep hawkish Fed voices louder than dovish ones heading into September.
Promotion: U.S. core PCE and preliminary GDP data dropping at the same time can strongly influence USD trends. TradeZella’s AI trading partner can analyze your trades, uncover recurring patterns, and build a game plan for your next move.
Start Your Trading Journey with TradeZella & use code “PIPS20” for 20% off your first purchase!
Disclosure: To help support our free daily content, we may earn a commission from our partners if you sign up through our links, at no extra cost to you.
What Does This Mean for Markets?
The immediate reaction favored the dollar. PCE Price Index remained unchanged at 3.7% in July, while analysts expected it would drop to 3.6%. The report provided material support to the American currency as traders worried about potential rate hikes.
The CME FedWatch Tool indicated a 40.1% probability that the Fed will raise the federal funds rate at the September meeting, and separate CME data showed odds of the Fed holding steady climbing toward 64%. Cuts, for now, carry almost no pricing at all.
EUR/USD felt it directly. The pair accelerated its losses to multi-day troughs around 1.1650, retreating on the back of a solid performance from the U.S. Dollar in the wake of the July PCE data and GDP figures. GBP/USD pulled back below 1.3600. USD/JPY edged higher as Treasury yields ticked up.
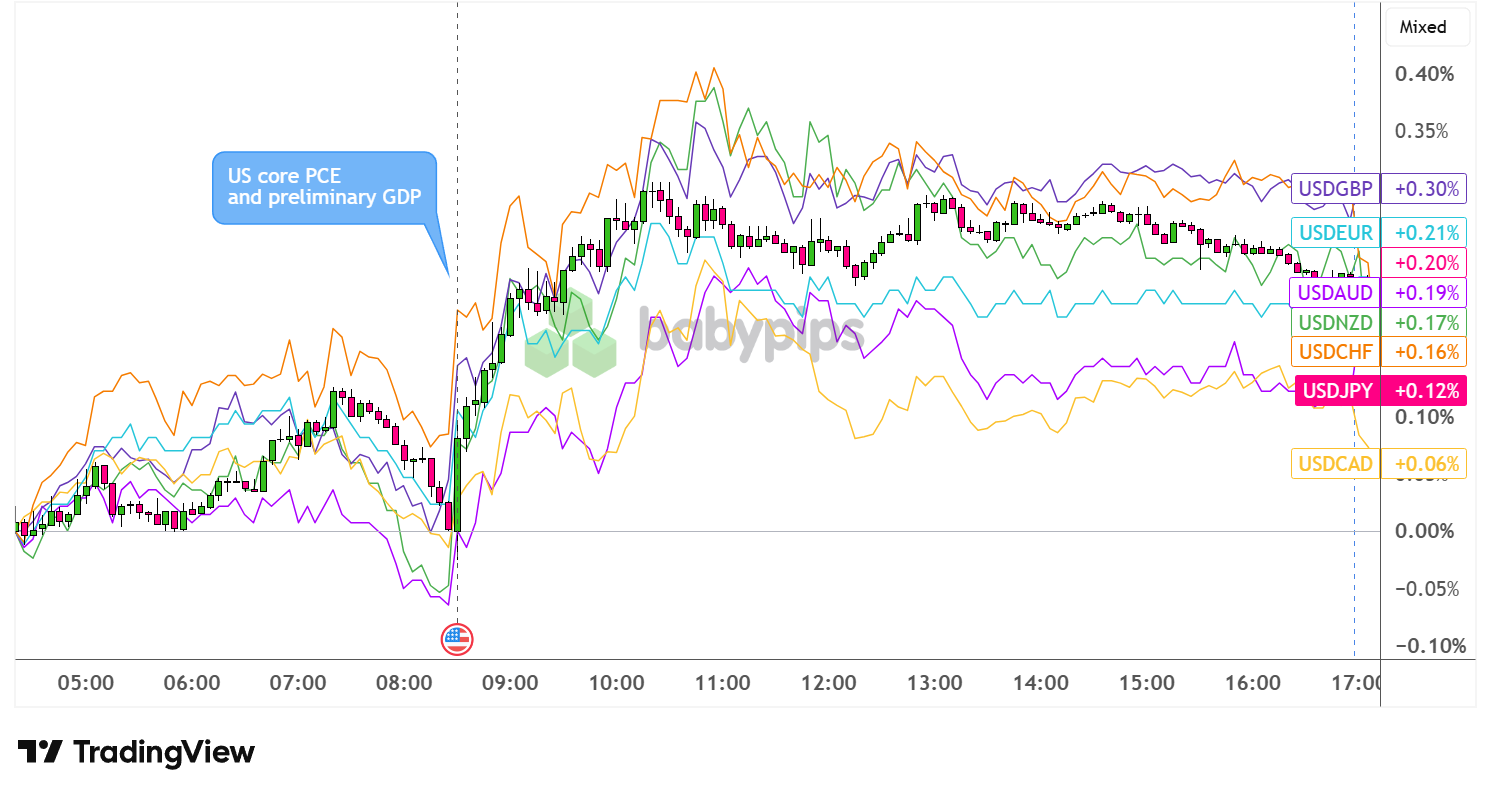
USD 5-min Overlay with Major Currencies Chart Faster with TradingView
This connects to a broader forex concept worth understanding: rate expectations, not just rate decisions, move currencies. A currency tends to strengthen when traders raise their odds of future hikes, even before any hike actually happens, because higher expected yields make holding that currency more attractive.
Longer term, this data alone won’t settle anything. One report, even a closely watched one, rarely does. Federal Reserve Chair Kevin Warsh speaks at Jackson Hole on Friday, and his tone could matter more to markets than Wednesday’s numbers.
The Bottom Line
- Core PCE held at 3.3% year-over-year in July, still well above the Fed’s 2% target, while the headline rate rose to 3.7%.
- Q2 GDP grew at a 1.5% annualized pace, confirmed at the second estimate, down from Q1’s 2.1%.
- Fed rate hike odds for the September 16 meeting rose to roughly 40%, an unusual reversal from the rate-cut expectations that dominated 2024 and 2025.
- The U.S. Dollar strengthened broadly, with EUR/USD sliding toward 1.1650 and GBP/USD dipping below 1.3600.
- Sticky services inflation and resilient household income both appear to be contributing factors, though no single data point tells the whole story.
- New traders should treat this as a live example of why “priced in” expectations, not just headline numbers, drive currency moves.
Fed Chair Kevin Warsh delivers his Jackson Hole address on Friday, August 28, and markets will parse it for hints on September.
The next FOMC rate decision lands September 16, 2026, at 2:00 PM ET. Between now and then, expect August jobs data and the next CPI report to carry outsized weight in shaping which way that 40% hike probability moves.
This article covers sticky core PCE inflation and a resilient Q2 GDP reading, but if you’re wondering why the dollar rallied on data that mostly matched forecasts, there’s a concept behind that. Premium members can read our lesson:
📖 Market Expectations: Why Good News Can Tank a Currency
Reading this helps you understand why currencies react to the deviation from expectations rather than the headline number itself, how a single beat on core PCE can shift Fed rate hike odds and move the dollar broadly, and how to apply this framework the next time a data release seems to move markets in a way the headline alone doesn’t explain.
And if you’re not a Premium subscriber yet, now’s a good time to sign up.
With Babypips Premium, you get full access to School of Pipsology lessons that help you understand not just what the headline inflation or GDP number says, but why the market’s prior expectations are what actually determine how a currency reacts to it.



