Welcome to a new trading year!
If one of your resolutions is to catch more trading opportunities, then you’ll definitely want to check out what’s brewing on BTC/USD, GBP/JPY, and Brent Crude’s longer time frames.
Let me know if you’re also watching the same resistance zones!
BTC/USD: Daily

Bitcoin breaking below a trend line support and trading below the daily chart’s 200 SMA is NOT a good look for the HODLers out there.
Luckily, $46,000 is a major area of interest for the king of crypto and it doesn’t look like the bears are committed to drag BTC/USD consistently below the level just yet.Watch the tug-o-pips around Bitcoin’s current levels!
A clear bounce from $46,000 could push BTC/USD back above the $50,000 mark and maybe inspire a visit to the $55,000 zone near the 100 SMA.
Sustained trading below the $46,000 mark, however, could bring traders to the bears’ yard and drag BTC/USD to the $35,000 – $40,000 area. Yikes!
GBP/JPY: Daily

Range traders huddle up! GBP/JPY is a hair’s breadth away from the 156.25 zone that has held as resistance at least twice since mid-2021.
Now that Stochastic is flashing an overbought signal, you can bet that at least some bears are eyeing a trip lower.
A rejection at 156.25 opens GBP/JPY to a drop to the 152.50 mid-range or even the 149.50 range support levels.
If Guppy breaks above the range resistance, however, then you can start aiming for the 162.00 – 163.00 previous areas of interest.
Brent Crude Oil: Weekly
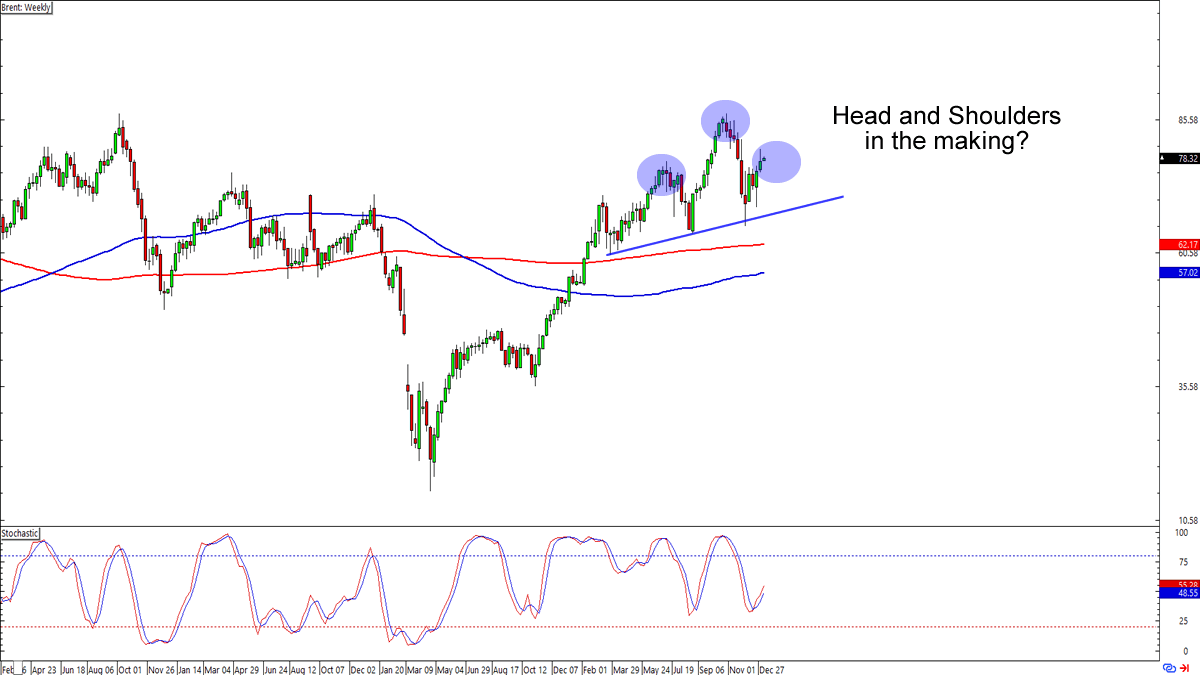
That’s right! After at least two failed attempts to break above the $80 – $85 zone, Brent crude could be forming a Head and Shoulders pattern.
Look out for consolidation or rejection around the current levels, which could lead to a dip down to the pattern’s “neckline” and then a downside breakout to the 200 simple moving average.
If Brent crude successfully busts above December’s highs, though, then we might see the commodity make another run for the $80 – $85 resistance zone.