


The U.S. April CPI report churned out higher-than-expected headline and core readings, both on a monthly and annual basis, reinforcing the case for higher Fed interest rates sooner rather than later.
Against a backdrop of shifting yet mostly risk-off sentiment, the results also propped up the dollar’s safe-haven advantage. Check out which of our setup ideas moved beyond the watchlist stage!
Watchlists are price outlook & strategy discussions supported by both fundamental & technical analysis, a crucial step towards creating a high-quality discretionary trade idea before working on a risk & trade management plan.
If you’d like to follow our “Watchlist” picks right when they are published throughout the week, check out our BabyPips Premium subscribe page to learn more!
The Setup
What We Were Watching: U.S. Consumer Price Index (April 2026)
- Expectation: Headline CPI to show 0.5% monthly uptick vs. earlier 0.9% increase, core CPI to accelerate from 0.2% to 0.3% month-on-month
- Data outcome: Headline CPI rose 0.6% month-on-month to bring the annual rate up to 3.8%, core CPI up to 2.8% year-on-year
- Market environment surrounding the event: Risk sentiment was looking fragile leading up to the CPI release, as Trump had declared the US-Iran ceasefire being on “life support” after Tehran rejected the latest peace proposal, while market uncertainty loomed ahead of Kevin Warsh’s confirmation as next Fed Chair
Event Outcome
The U.S. CPI report for April 2026 printed better than expected results for both headline and core inflation, with the latter showing the largest monthly gain in over a year. Energy surged 17.9% y/y and 3.8% m/m, accounting for over 40% of the monthly all-items increase. Food rose 3.2% y/y with grocery prices up 0.7%, the largest monthly gain since August 2022.
A one-time rent adjustment following the fall government shutdown contributed to the core overshoot, though price gains were broad enough (airline fares, apparel, household furnishings) to matter independently.
Key Takeaways:
- Headline CPI: 3.8% y/y (beat 3.7% forecast; prior 3.3%) | 0.6% m/m (in line)
- Core CPI: 2.8% y/y (beat 2.6% forecast) | 0.4% m/m (beat 0.3% forecast) — largest monthly core gain since January 2025
- Energy: 17.9% y/y, 3.8% m/m; accounted for over 40% of the monthly all-items increase; gasoline jumped 5.4% m/m and 28.4% y/y
- Food: 3.2% y/y | 0.5% m/m; grocery prices up 0.7% m/m (largest since August 2022)
- Real wages: -0.3% y/y — first annual real wage decline since 2023
- Shelter / Rent note: A one-time BLS rent adjustment (from the fall government shutdown’s estimate backlog) contributed to the core overshoot; however, gains were broad across apparel, airline fares, furnishings, and personal care
Though some profit-taking led to dips ahead of the actual inflation report, the dollar maintained a steady bullish trajectory fueled in part by safe-haven flows. The U.S. dollar rallied broadly after the release, as traders took the upside inflation surprises as additional confirmation that the Fed is more likely to tighten rather than loosen monetary policy later in the year or in 2027.
Fundamental Bias Triggered: Accelerating and stronger-than-expected headline and core inflation prints bolstered hawkish Fed expectations and therefore sustained a net bullish USD reaction.
Promotion: Top-tier catalysts like the U.S. CPI report can trigger emotional execution. TradeZella AI powered journal turns your raw data into a high-performance playbook. Sync your broker, replay your trades bar-by-bar, and use the Playbook Designer to ensure that next time an economic data point surprises the market, you’re executing with clinical precision.
Click on the link to learn more and use code “PIPS20” to save 20% off first purchase!
Disclosure: We may earn a commission from our partners if you sign up through our links, at no extra cost to you.
Broad Market and Exogenous Drivers:
Geopolitical Risk Turnaround (Monday-Tuesday): The week opened with equities soaring to record highs driven by semiconductor sector strength and shaky optimism, though geopolitical doubts started to filter in as Monday progressed. The following day flipped the narrative, as diplomatic talks deteriorated overnight and Trump declared that the US-Iran ceasefire was on “life support” while hinting that they are reconsidering military action in the region.
Markets also positioned cautiously ahead of two main US events for the day: the CPI release and Kevin Warsh’s confirmation as next Fed head. When the actual inflation numbers landed, it confirmed the stagflation narrative and hawkish Fed tilt, allowing DXY to rally to a weekly high near 98.45 while the S&P 500 dipped to 7,394.5 to close with a marginal 0.20% loss.
Spotlight on Trump-Xi (Wednesday-Thursday): By midweek, the market attention had shifted to Trump’s state visit to Beijing, prompting some risk-off flows on anticipation of developments that could be beneficial to the global economy. U.S. equities surged to fresh record highs, buoyed by tech megacap enthusiasm, even as the April U.S. PPI also beat expectations dramatically and further boosted Fed rate hike expectations.
Risk-taking appeared to be the dominant theme for the day, with the dollar reversing lower through the U.S. afternoon session despite the upbeat PPI, while higher-yielding assets ripped higher, though Warsh’s narrow 54-45 confirmation vote brought more uncertainty rather than clarity on the Fed’s policy path.
Risk Rebound and Retreat (Thursday-Friday): Net positive headline brought a textbook risk-on lean towards the end of the week, though downbeat U.K. trade activity and political uncertainty surrounding Prime Minister Starmer’s leadership brought headwinds for Europe. Still, stronger-than-expected U.S. retail sales data, AI-led gains, and the CLARITY Act finally passing the Senate sparked notable risk rallies for equities and crypto.
Profit-taking came into play on Friday, as the Trump-Xi summit and US-Iran negotiations lacked any meaningful breakthrough. Another round of stronger-than-expected U.S. economic data points (Empire State manufacturing index, industrial production, and capacity utilization) reinforced the high interest rate narrative that allowed the dollar to chalk up one of its best weekly performances in two months.
Scenario Scorecard: How Did They Play Out?
EUR/USD: Bullish USD Event Outcome + Risk-Off Scenario = Arguably good odds of a net positive outcome
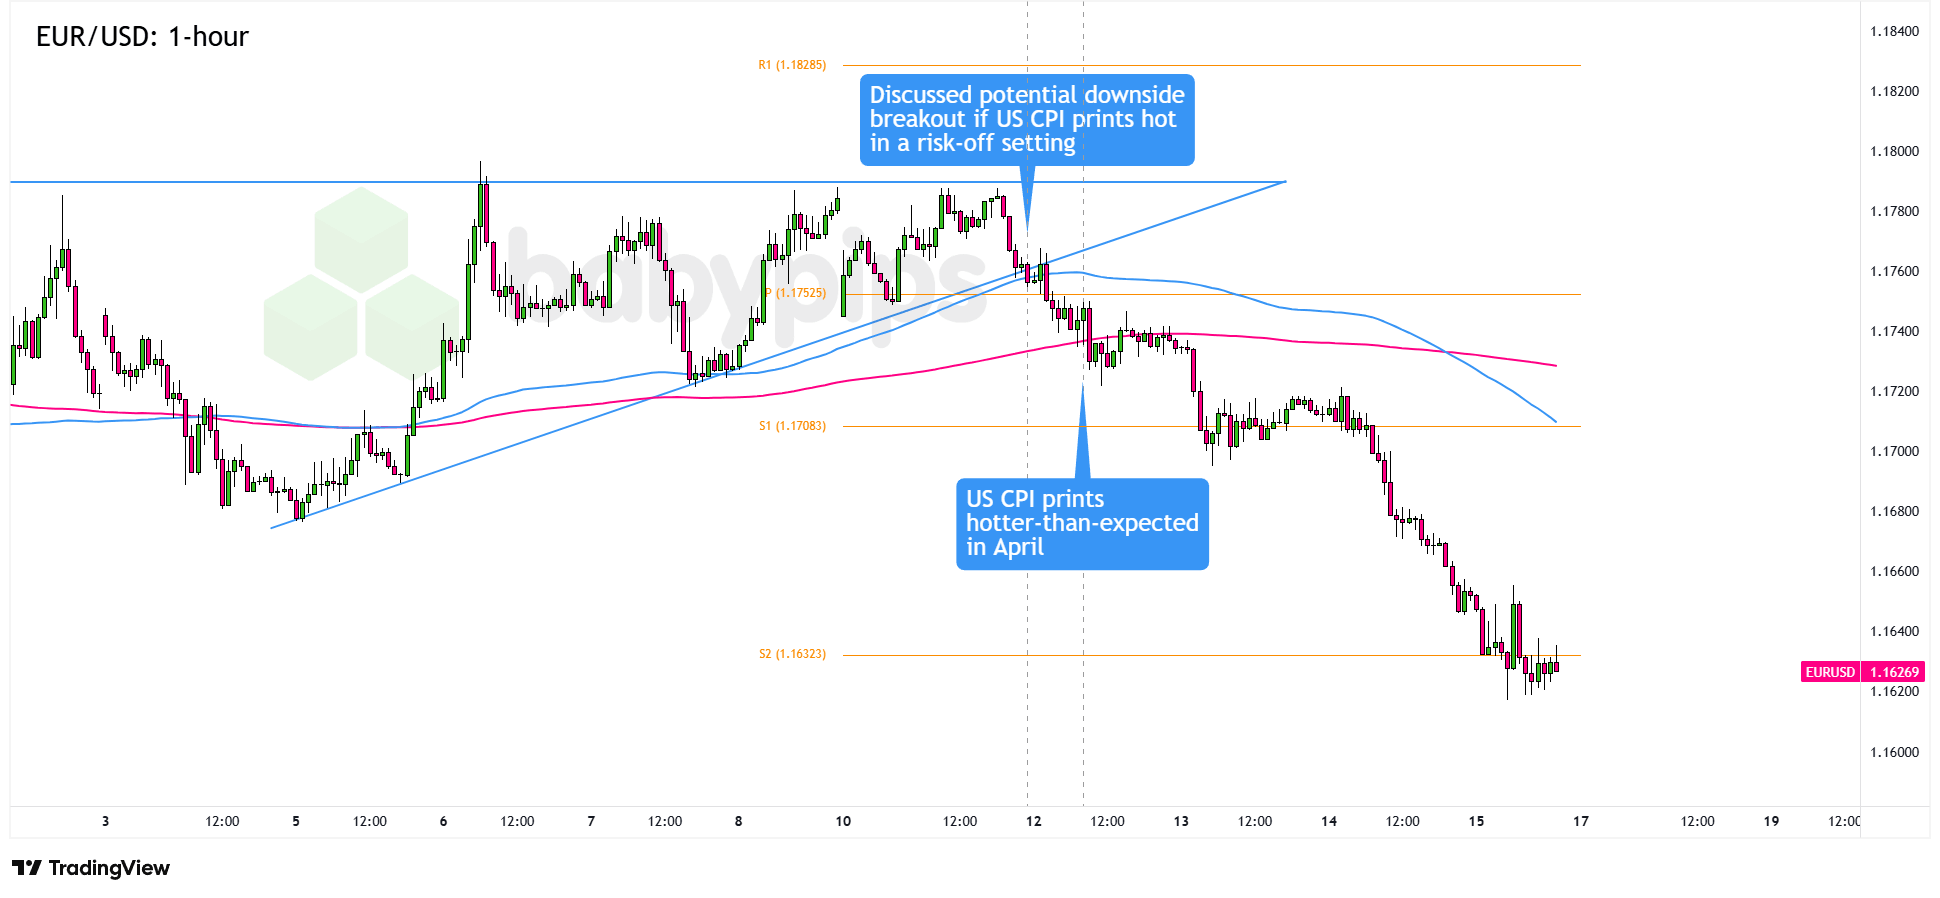
EUR/USD 1-hour Forex Chart Faster with TradingView
Our analysts flagged an ascending triangle pattern on the hourly chart of EUR/USD, eyeing a possible breakdown below the 1.1750 minor psychological support in case the U.S. CPI comes in hotter than expected in a risk-off environment.
Both conditions materialized cleanly: all four CPI readings beat forecasts, and the market backdrop was defined by renewed U.S.-Iran military escalation fears and Warsh confirmation jitters that kept risk appetite compressed. On that basis, EUR/USD’s watchlist discussion was arguably the best-positioned setup to move beyond the watchlist stage.
By the time the CPI landed, EUR/USD was already under modest pressure from the safe-haven dollar demand built during the Asian session on the Iran military review headlines — the same, backdrop that provided the risk-off leg of the scenario. The hot print triggered further bearish reaction, with EUR/USD staying below the ascending triangle support and the 100 SMA in the hours following the release.
Euro-specific fundamentals added to the bearish case after the CPI report landed, as flash GDP readings from top economies failed to impress while mixed ECB commentary generally favored a “wait and see” stance, widening the policy divergence with an increasingly hawkish Fed as upbeat U.S. data kept trickling in.
It’s worth noting that the EUR/USD selloff wasn’t a straight-line move, as the dual nature of the week (which featured a notable mid-week risk rebound on Trump-Xi optimism and tech equity rallies) provided brief support for EUR before the broader dollar domination reasserted itself.
Still, the ascending triangle breakdown ahead of the target event built the case for a risk-off mood and projected move towards the next major support zones near S1 (1.1708) while also leaving possibilities open for pullbacks that aligned with risk rebounds within the broader selloff. This may have offered opportunities for those managing positions through the volatility rather than expecting a clean one-directional move.
Promoted: Capitalize on the News Events Without Risking Your Own Funds.
In an economic data surprise, the corresponding currency can swing wildly intraday. Why risk your personal capital during extreme volatility?
Most proprietary firms terminate your evaluation account if you execute a trade during a major macroeconomic release, but FundedNext permits news trading across all models. Test 020your thesis with up to $300,000 in simulated capital, or take advantage of their Free Trial to experience the platform risk-free.
Explore FundedNext and Start Your Free Trial!
Disclosure: We may earn a commission from our partners if you sign up through our links.
Not Eligible to Move Beyond Watchlist – USD/JPY & Bearish USD Setups
USD/JPY: Bullish USD Event Outcome + Risk-On Scenario
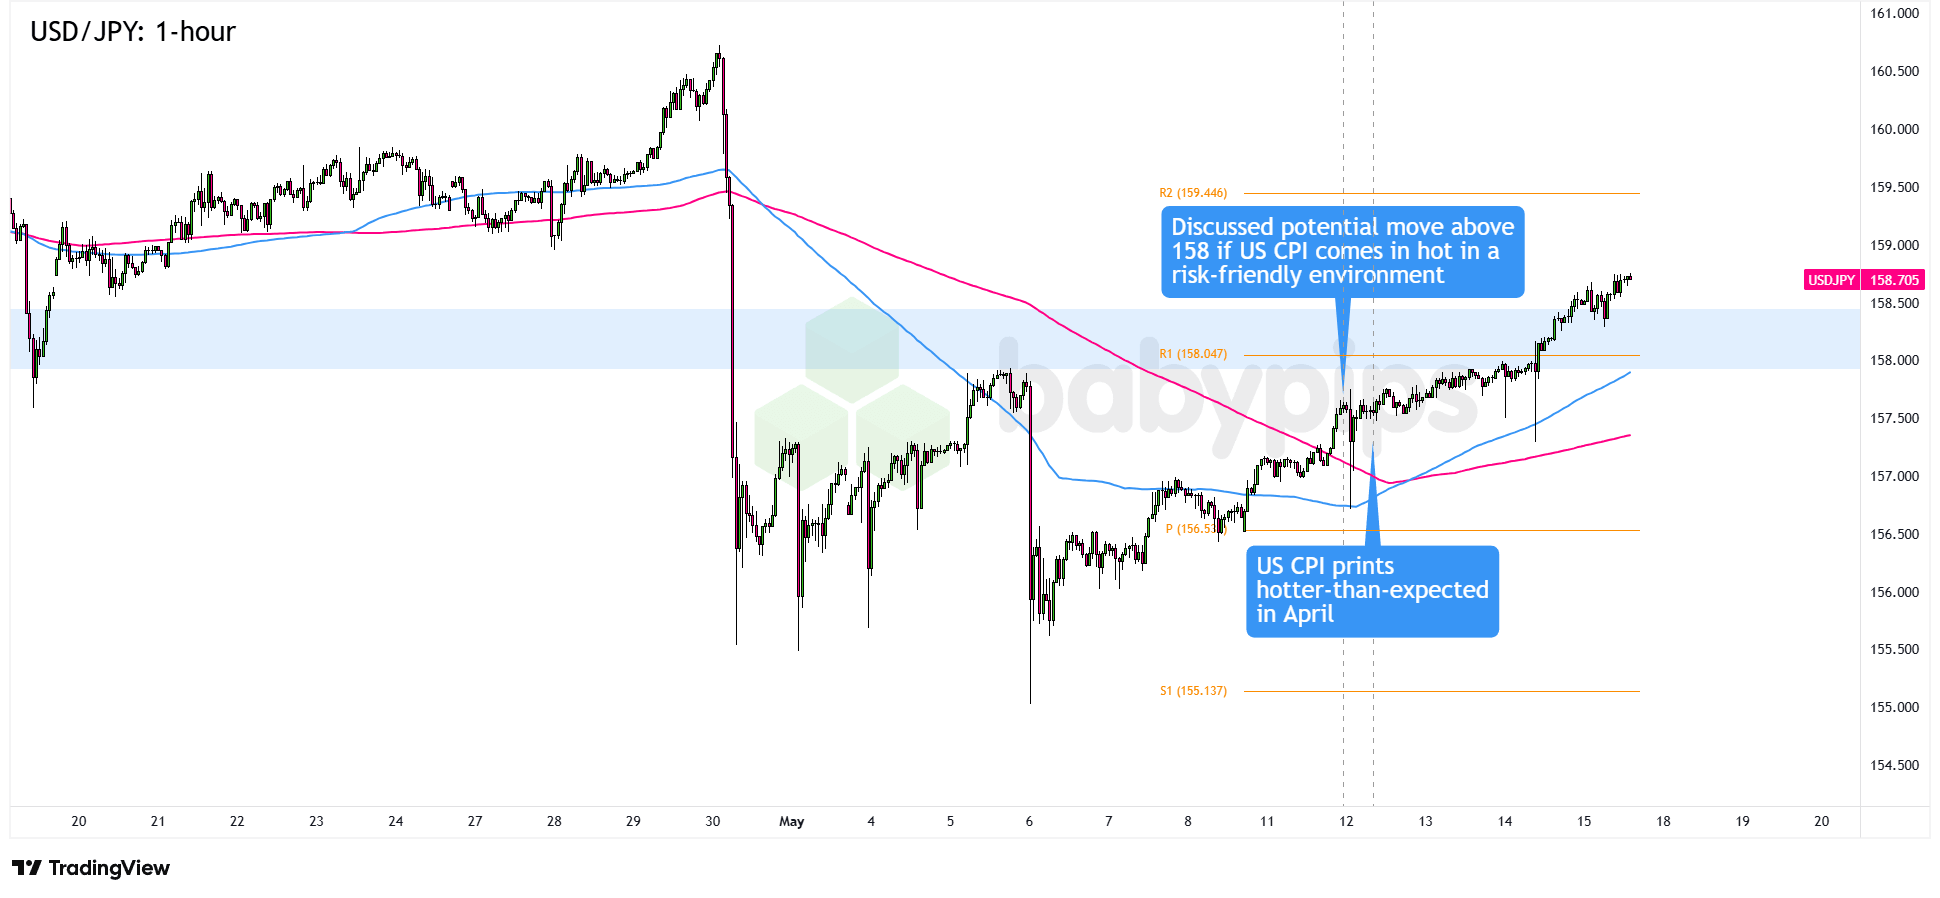
USD/JPY 1-hour Forex Chart Faster with TradingView
The watchlist setup looked at this pair sitting below the 158.00 major psychological handle, envisioning a stronger rally past this resistance zone onto the 160.00 yen-tervention ceiling should the U.S. CPI come in above expectations in a risk-friendly scenario.
Although the fundamental triggered clearly delivered a headline and core CPI beat, which reinforced the policy divergence between a hawkish Fed and a cautious BOJ, the complicating factor was the shifting risk sentiment that mostly leaned in favor of the safe-haven dollar versus the intervention-prone yen.
Risk sentiment on Tuesday was defined by the combination of renewed U.S.-Iran military escalation concerns and the restrictive policy implications of the CPI beat itself, both of which limited risk appetite and kept commodity currencies and equities under pressure.
Another round of suspected BOJ intervention activity also generated short-lived yen rallies at various points during the week, adding noise to the USD/JPY setup and possibly discouraging traders from taking large yen positions despite the general risk-off lean during the week.
That said, the pair still moved meaningfully in the anticipated direction. The original setup favored risk-friendly conditions because that would have supported yen weakness through both carry and sentiment. But hot CPI did the job on its own, with wider rate differentials replacing the risk sentiment tailwind.
Traders who spotted that distinction and focused on the data outcome, rather than the broader risk backdrop, were best positioned to benefit.
USD/CHF: Bearish USD Event Outcome + Risk-On Scenario
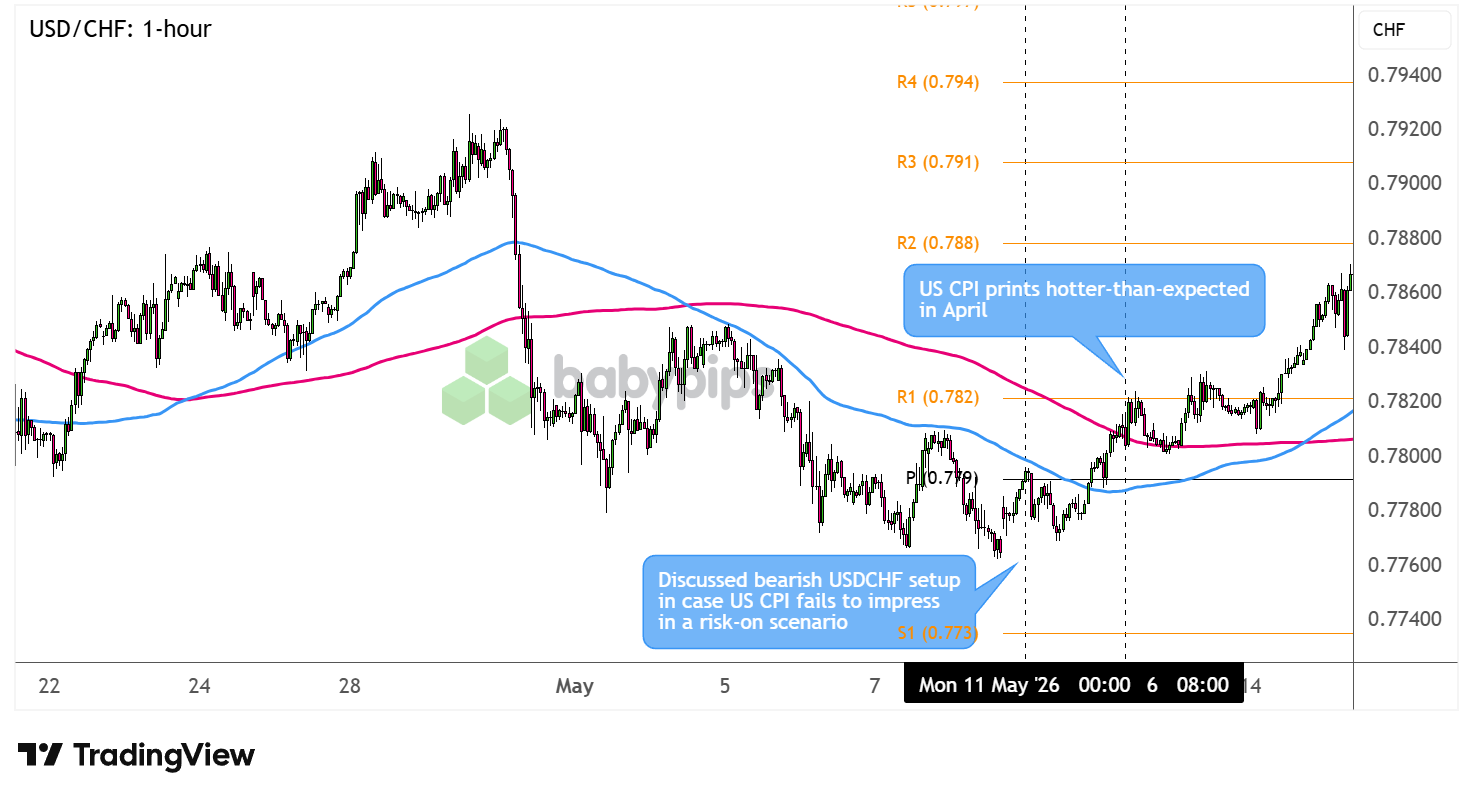
USD/CHF 1-hour Forex Chart Faster with TradingView
USD/CHF had been forming a descending triangle on the hourly time frame, exhibited by lower highs converging on flat support around .7780, with the pair testing resistance at the Pivot Point (.7790) and 100 SMA dynamic resistance ahead of the CPI event.
The risk-on scenario anticipated that an in-line to marginally stronger U.S. inflation print could trigger an initial break higher, with R1 (.7820) near the 200 SMA as a near-term roadblock and the .7850 area as support-turned-resistance that could attract dollar sellers looking to fade the move.
While market environment arguably aligned in favor of this setup, the CPI beat provided a dollar-positive catalyst that kept the pair supported for the most part of the week, even as risk flows shifted.
Even though the SNB’s openness to negative interest rates and currency intervention could structurally cap CHF rally attempts, markets appeared to shrug off better-than-expected Swiss Producer and Import Prices and took out one key resistance level after another while dollar domination remained a major theme.
AUD/USD: Bearish USD Event Outcome + Risk-Off Scenario
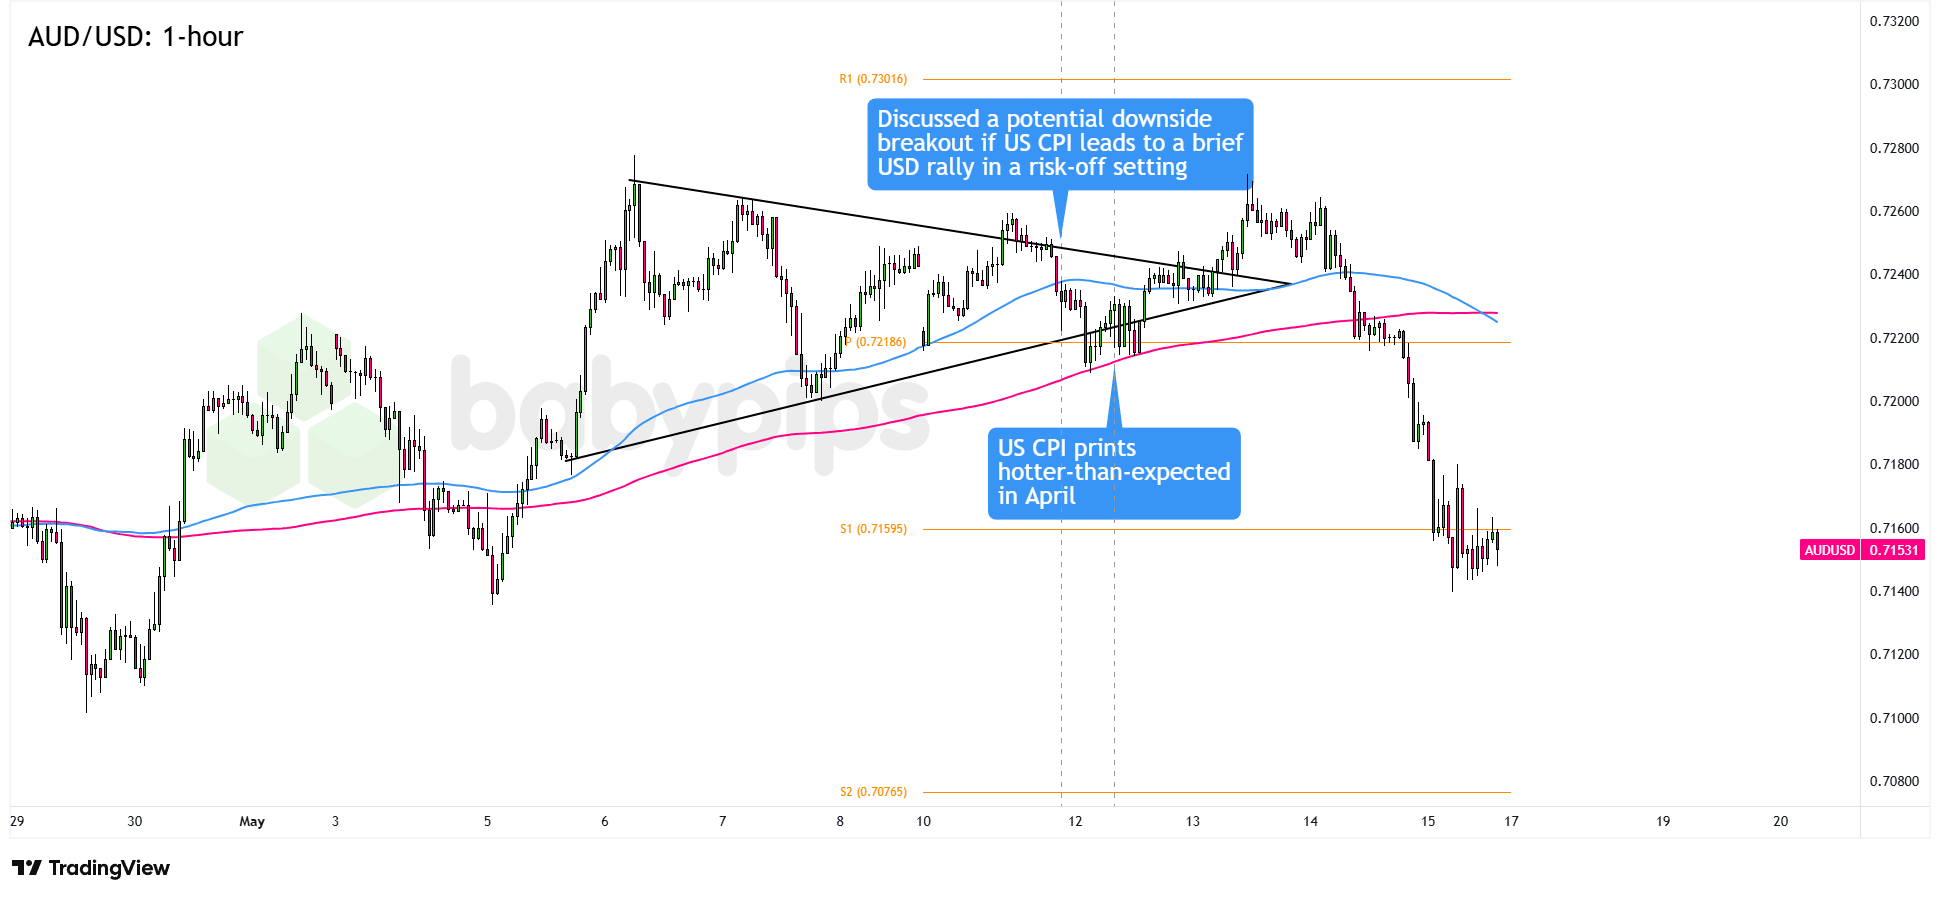
AUD/USD 1-hour Forex Chart Faster with TradingView
AUD/USD entered the CPI event in a tight symmetrical triangle on the 1-hour chart, having bounced off resistance and working its way toward triangle support near the Pivot Point (.7222) and 100 SMA.
The risk-off scenario anticipated that stronger-than-expected CPI could spur a break below the triangle bottom, with downside targets at S1 (.7160) and horizontal support around .7120–.7130. The watchlist also acknowledged an elevated complication: the RBA’s less-hawkish-than-expected announcement prior to the event had already put the Aussie “on shaky ground,” while ceasefire doubts were returning to the mix.
The fundamental outcome of a hot CPI print reinforcing Fed higher-for-longer expectations turned out bearish for a higher-yielding commodity currency like AUD, particularly in a risk-off environment.
Some AUD gains linked to Australia’s Q1 Wage Price Index reading alongside broader tech-related risk-on sentiment provided tailwinds for the pair, and this mid-week exception could have complicated timing for those positioned short AUD/USD through the week’s inflation catalysts.
By Friday, however, the combination of WTI breaking above $100, 10-year yields climbing above 4.5%, and the Trump-Xi summit producing no Iran breakthrough likely reestablished the risk-off, dollar-supportive environment that the setup’s scenario required.
For those managing the setup, the mid-week equity surge and Aussie resilience arguably created either a challenge to ride through or a second entry opportunity at improved levels.
The Verdict
The U.S. CPI week featured a complex yet consequential macro backdrop: two major inflation prints, a Fed leadership transition, a Beijing summit, and an active geopolitical flashpoint all running simultaneously.
Within that environment, the bias triggered by the hotter-than-expected April CPI print leaned dollar bullish on both fundamental and market sentiment fronts, with the EUR/USD play getting an additional downside push from a divided ECB and weak eurozone data points.
EUR/USD’s downside move from the ascending triangle arguably presented the clearest directional setup, with both the CPI outcome and EUR-specific weakness (soft Q1 GDP, cautious ECB) reinforcing the bearish EUR thesis.
Though USD/JPY’s bullish case was fundamentally well-supported, BOJ intervention noise and session-by-session risk swings likely made execution more challenging than the watchlist’s clean framework suggested.
Keep in mind, however, that the technical entry area was already reached ahead of the target event rather than a direct response to it, which is a reminder that geopolitically-driven sentiment can strongly dominate price action.
With that, we rate the EUR/USD watchlist discussion as “neutral to likely“ supportive of a net positive outcome, as the pair already broke below the levels discussed in the setup ahead of the target event but still managed to sustain its bearish trajectory and offered other entry possibilities within the broader trend.
Traders who entered short EUR/USD on the confirmed break below ascending triangle support, or on a retest of the broken 200 SMA support, were most likely to see a net positive outcome given the sustained directional follow-through that carried through Thursday and into Friday. Post-event price action was directional rather than choppy, limiting the scenario where entries depended heavily on execution timing or trade management to generate a positive result.
Traders who kept an eye out for intraday pullback and breakdown opportunities could have still capitalized on the bearish move, which was sustained for the remainder of the week, as the pair fell through one key support zone after another to close notably below pre-event levels.
Key Takeaways:
Macro Headwinds Can Trump Central Bank Biases
In this particular case, BOJ hawkishness barely mattered, even as the Summary of Opinions leaned in favor of further tightening, as markets remained anxious of currency intervention activity. Higher-for-longer Fed expectations supported by upbeat data points also proved too formidable for the yen to overpower.
Geopolitical Binary Risk Can Complicate Fundamentals
US-Iran ceasefire dynamics early in the week and Trump-Xi optimism sparked major moves, concluding with a general risk-off lean on market disappointment over the lack of a big breakthrough. None of these contradicted the inflation-driven bullish dollar thesis but created intraweek swings that offered pullback opportunities.
In weeks where geopolitical events tend to bring noise rather than a clear trend shift, remain flexible around timing and entries while the broader directional bias remains clear. Building setups with wider invalidation points or leaving space for scaling in could provide more breathing room and improve execution quality.
A Broad-Based CPI Beat Carries More Weight Than a Headline Surprise Alone
A headline CPI beat driven by energy alone is easy for the market to discount. When core confirms the same direction, the hawkish signal is harder to dismiss, and the repricing tends to hold. That distinction is worth building into how you size and hold a dollar-bullish trade around CPI events.
This watchlist recap covers a hot U.S. CPI print and the market reactions that followed, but if you’re not familiar with how economic data actually moves currency prices, it can be hard to interpret what happened and why. Premium members can read our lesson:
📖 From Data to Price Action: What Happens When Big News Hits
Reading this helps you understand how inflation data triggers FX moves, the difference between the initial algorithmic spike and the secondary analytical move, and why the post-release environment is often where the real trade opportunity lies.
And if you’re not a Premium subscriber yet, now’s a good time to sign up.
With Babypips Premium, you get full access to School of Pipsology lessons that help you understand not just what the chart is showing after a data release, but the mechanics behind why price moved the way it did.
This content is strictly for informational purposes only and does not constitute as investment advice. Trading any financial market involves risk. Please read our Risk Disclosure to make sure you understand the risks involved.


