





XAG/USD just took a sharp hit, sending silver quickly lower.
Now the focus shifts to what happens next. Can buyers step in and steady the market, or will sellers keep the pressure on?

After a move this strong, waiting for clear signs of stabilization may be more useful than trying to guess the bottom.
Welcome to “TA Alert of the Day.” Each day after the market close, MarketMilk scans for popular technical indicator alerts. We use these alerts as the basis for a mini-lesson, breaking down what each alert means, why it matters, and how traders might interpret it. The goal is to help beginner traders not only spot these alerts but also understand the logic behind them and how they can inform trading decisions.
What MarketMilk Has Detected
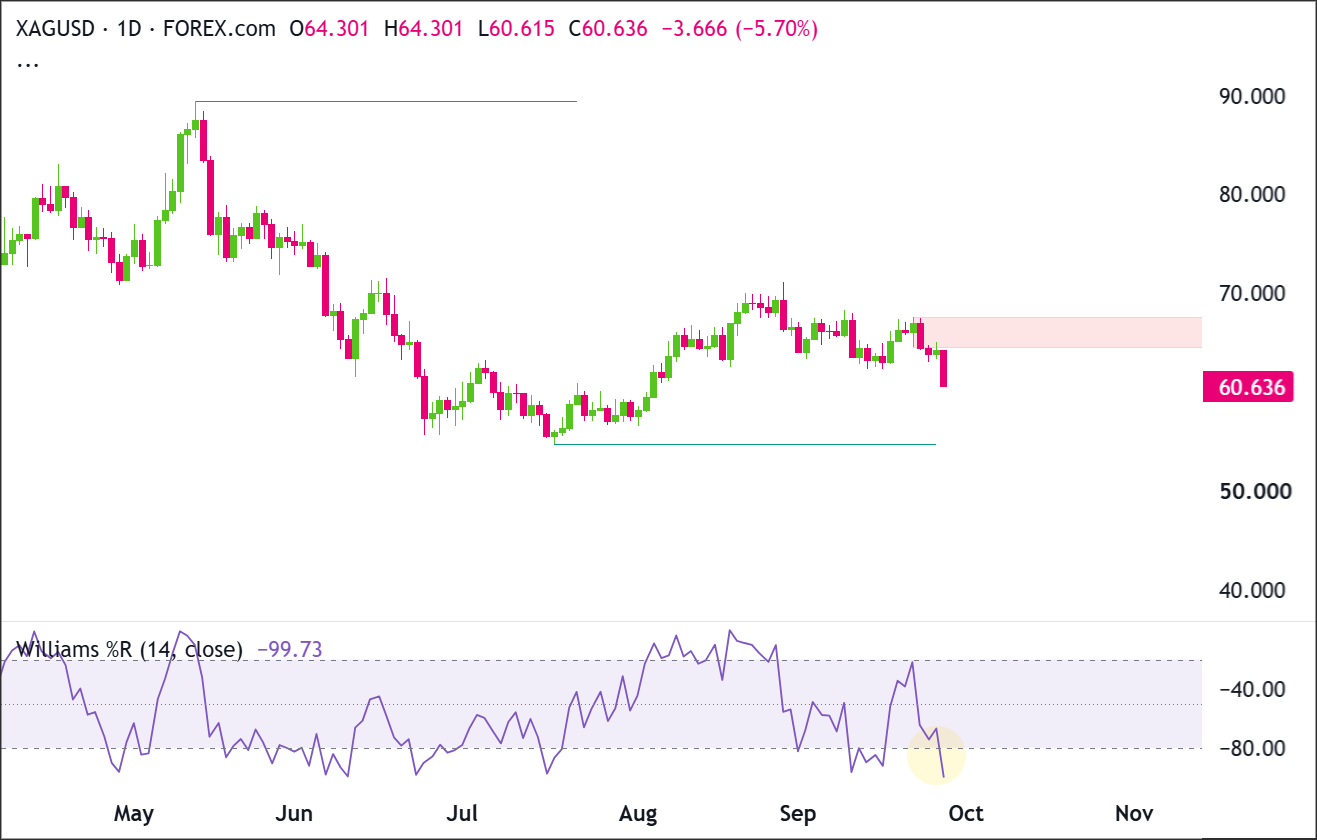
Williams %R (14) has moved deep into oversold territory, falling well below the -80 level.
This happened alongside a sharp daily selloff, with price closing near the session low.
What This Signals
An oversold Williams %R reading means XAG/USD has fallen quickly and selling has become unusually strong.
Sometimes, this can lead to a bounce as buyers step in or sellers take profits. If Williams %R moves back above -80, traders may see that as an early sign that selling pressure is starting to ease.
But oversold does not always mean price is ready to recover.During a strong downtrend, Williams %R can stay oversold for some time while price continues falling.
Even if XAG/USD does bounce, the recovery could be temporary. Price may rise back toward a previous support area, which could now act as resistance, before sellers step in again.
That is why traders often wait for confirmation. Signs that price is stabilizing, holding support, and showing stronger upward momentum can help determine whether the selloff is losing strength or still has room to continue.
How It Works
Williams %R is a momentum indicator that shows where the current price sits compared with its recent high and low over a set period, in this case 14 periods.
The indicator moves between 0 and -100. Readings above -20 are usually seen as overbought, while readings below -80 are seen as oversold.
You can use Williams %R to spot when price has moved strongly and may be reaching an extreme. It doesn’t predict what happens next, but it can help show when buying or selling momentum has become unusually strong.
Important: Oversold momentum does not mean price “must” reverse. In persistent trends, the oscillator can remain oversold for multiple candles, so traders often combine it with structure (support/resistance), reversal candles, or momentum recovery signals to reduce false starts.
What to Look For Before Acting
Don’t assume XAG/USD is ready to rally just because it looks oversold. Here are a few things that you may want to watch:
✅ Williams %R moves back above -80, which can be an early sign that selling pressure is easing.
✅ Price starts to stabilize instead of continuing to fall sharply.
✅ A bullish daily candle appears, especially one that shows buyers stepping in near the lows.
✅ Price climbs back above the 63.6–64.3 area.
✅ After a bounce, price pulls back but holds above its previous low.
✅ Price reaction around the 68.0–69.0 area, which could act as resistance.
✅ Moves in the U.S. dollar and interest rate expectations, which can affect silver prices.
✅ Major economic events, such as rate decisions, inflation reports, or jobs data, which can cause bigger price swings.
Risk Considerations
⚠️ Oversold can last: Williams %R can stay near -100 while price continues to fall during a strong selloff.
⚠️ Price could keep falling: A sharp drop like this can lead to bigger price swings and more selling.
⚠️ A bounce could fail: Price may recover toward the 63.6–64.3 area, only to turn lower again if sellers step back in.
⚠️ Economic news can cause sudden moves: Major reports or central bank decisions can quickly change market direction and make technical signals less reliable.
⚠️ Support may not hold: If price falls below the low 60s, traders may start watching the mid-to-high 50s as the next possible support area.
Potential Next Steps
Add XAG/USD to a watchlist and monitor whether the market can stabilize after this sharp selloff.
Williams %R has reached oversold territory, which shows selling pressure has become stretched and could lead to a short-term bounce.
Technical Analysis
XAG/USD recovered strongly after forming a major swing low around 54.5–55.0 in July, eventually reaching roughly 69.0–70.0 in August. Since then, price has moved sideways to lower, with repeated difficulty pushing through the upper part of the recent range.
The pink supply zone around 64.5–67.5 is now the main resistance area.
Recent completed candles show buyers struggling to hold gains after price moved back into the supply zone. This suggests sellers are still active in this area.
As mentioned, Williams %R has also reached oversold territory, showing that recent selling momentum has become stretched. This can sometimes lead to a rebound, but an oversold reading alone doesn’t confirm that buyers have regained control.
For buyers to improve the short-term picture, XAG/USD needs to hold around 63.0–64.0 and eventually close above 67.5.
Sellers would gain more control if price closes below 63.0, which could open the door to a deeper move toward the previous swing-low area around 55.0.
Trade Idea: Bullish Continuation Scenario
Setup
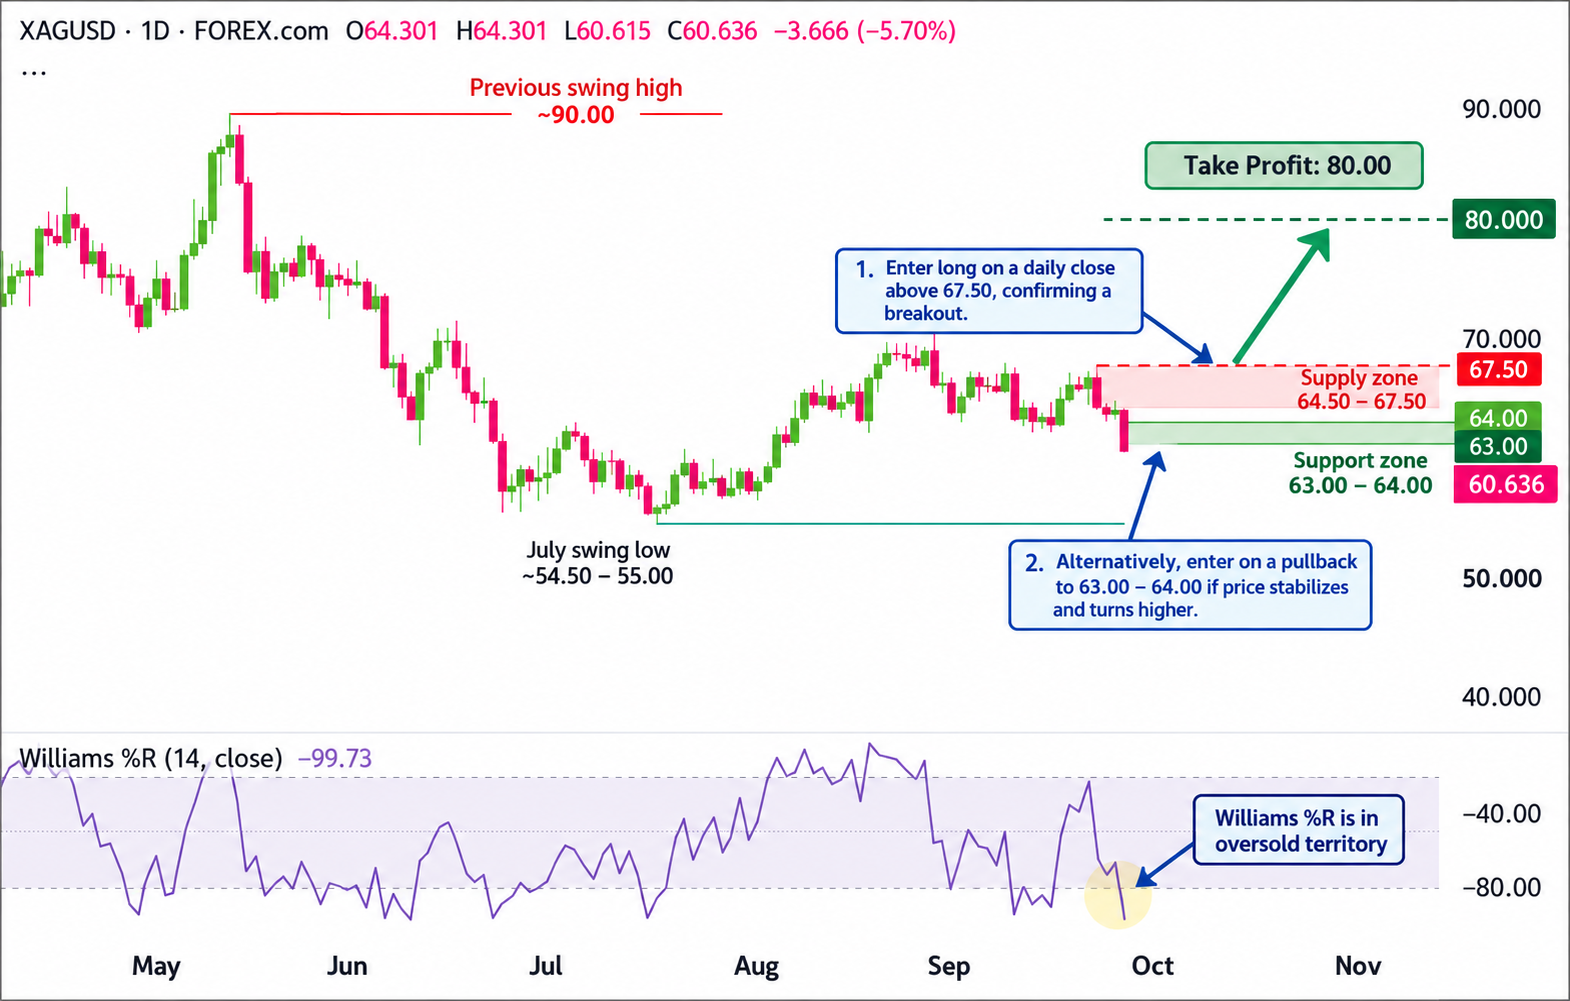
The bullish setup depends on buyers defending the 63.0–64.0 area and pushing price back through the pink 64.5–67.5 supply zone.
Williams %R being oversold could support a rebound, but the stronger bullish confirmation would come from price itself. A daily close above 67.5 would show that buyers have cleared the area where recent rallies have struggled.
Entry
Consider entering long on a daily close above 67.5, confirming that buyers are breaking out of the recent structure.
Alternatively, enter on a controlled pullback into 63.0–64.0 if price stabilizes there and turns back higher.
If price loses that support zone and closes decisively below 62.5, stand aside and wait for either deeper support to form or a cleaner breakout later.
Stop Loss
For breakout entries: stop on a daily close back below 66.0. This would invalidate the breakout by showing price could not stay above the former ceiling.
For pullback entries: stop on a daily close below 62.5. This would invalidate the support-hold idea and show buyers are no longer defending the zone.
Take Profit
Target 80.00, because it is a major round psychological number and would be a natural area for traders to watch if XAG/USD can break above the recent structure and build a stronger upside trend.
Bottom Line
The bullish case becomes much stronger if XAG/USD holds 63.0–64.0 and eventually closes above 67.5. Williams %R reaching oversold suggests selling may be stretched, but price still needs to confirm that buyers are returning.
A sustained breakout could put 80.00 in focus as the larger upside target. A decisive daily close below 62.5 would invalidate this bullish setup.
Trade Idea: Bearish Pullback Scenario
Setup
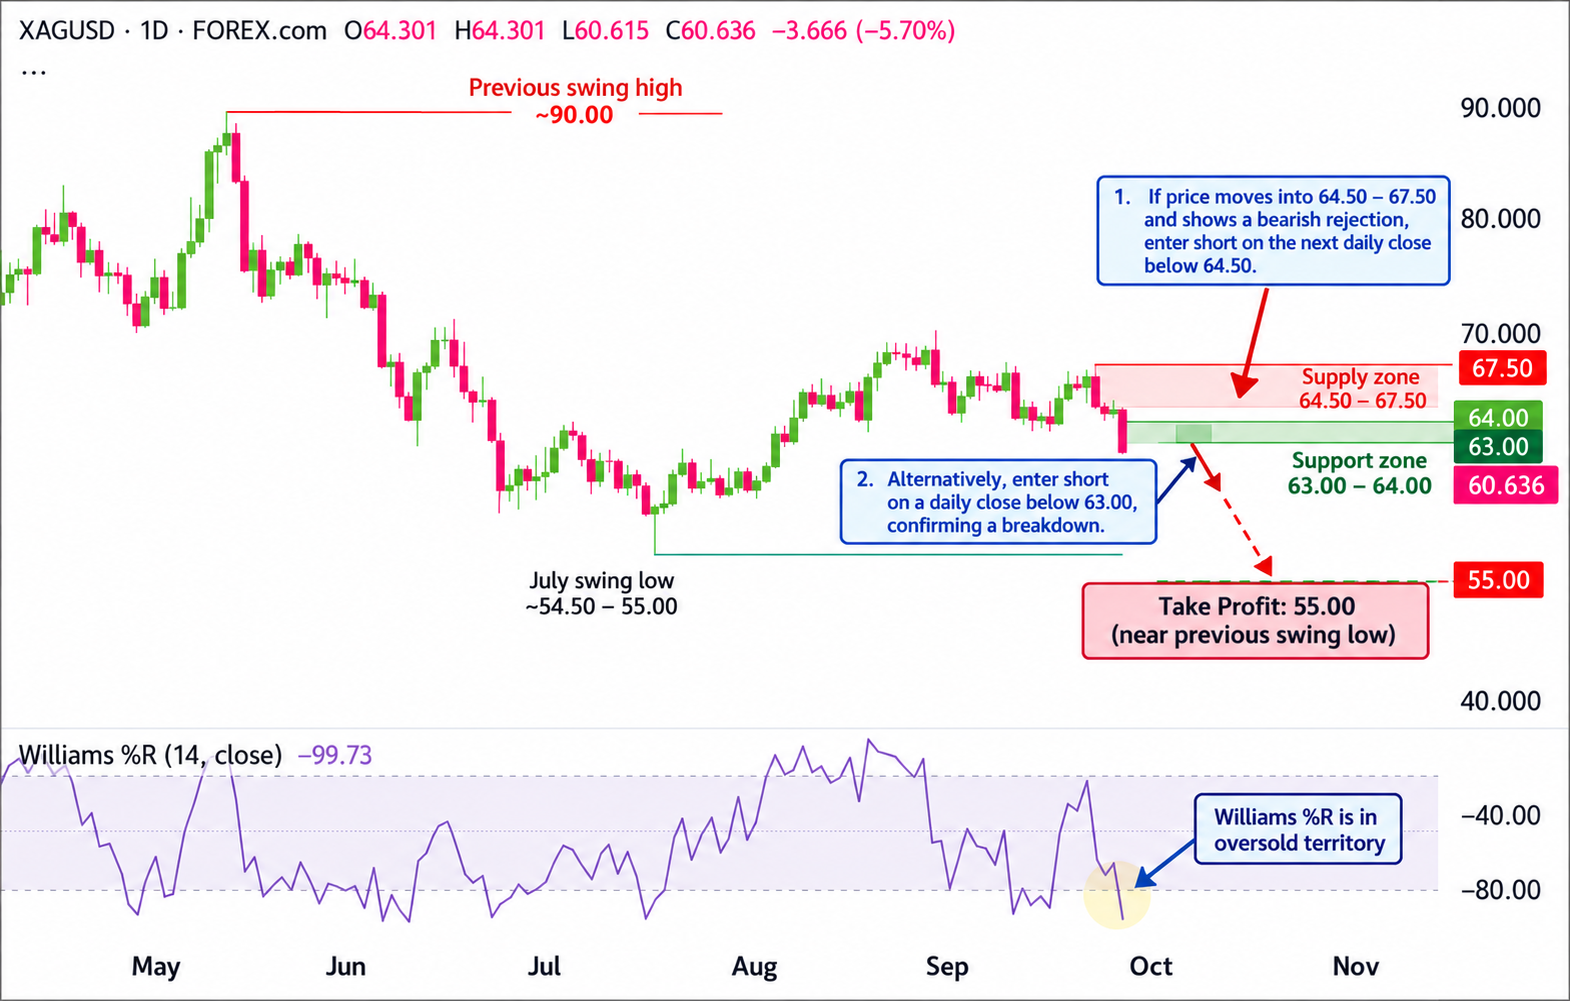
The bearish setup focuses on the possibility that the pink 64.5–67.5 supply zone continues to hold as resistance. Recent price action already shows buyers having difficulty maintaining strength in this area.
Sellers would gain stronger confirmation if XAG/USD breaks below 63.0. Williams %R is already oversold, so it makes sense to wait for price confirmation rather than relying only on the current downward momentum.
Entry
Consider entering short on a daily close below 63.0, confirming that the support zone has failed.
Alternatively, if price pushes into 64.5–67.5 and prints a clear bearish rejection candle, enter short on the next daily close back below 64.5.
If price instead breaks and closes decisively above 67.5, stand aside, as this would invalidate the bearish pullback idea.
Stop Loss
For breakdown entries: stop on a daily close back above 64.0. This would invalidate the breakdown by showing price has reclaimed the support zone.
For rejection entries near resistance: stop on a daily close above 67.5. This would invalidate the bearish idea by confirming buyers have pushed through resistance.
Take Profit
Target 55.00, because this is close to the previous major swing low and represents the next important support area if sellers continue to push price lower.
Bottom Line
The bearish case remains in play while XAG/USD stays below the 64.5–67.5 supply zone. A daily close below 63.0 would strengthen the case for a deeper move toward 55.00.
Williams %R being oversold means a bounce is possible along the way, so confirmation matters. A decisive close above 67.5 would invalidate the bearish setup.
This content is strictly for informational purposes only and does not constitute as investment advice. Trading any financial market involves risk. Please read our Risk Disclosure to make sure you understand the risks involved.



