





USD/JPY has been moving lower as the Japanese yen gains strength.
Traders are increasingly betting that the Bank of Japan could raise interest rates sooner, while speculation is also growing that Japanese investors may bring more money back home from overseas.
That selling pressure has pushed USD/JPY’s daily RSI into oversold territory.
The key question now is whether sellers can keep the move going, or whether buyers will step in and trigger a rebound.
Welcome to “TA Alert of the Day.” Each day after the market close, MarketMilk scans for popular technical indicator alerts. We use these alerts as the basis for a mini-lesson, breaking down what each alert means, why it matters, and how traders might interpret it. The goal is to help beginner traders not only spot these alerts but also understand the logic behind them and how they can inform trading decisions.
What MarketMilk Has Detected
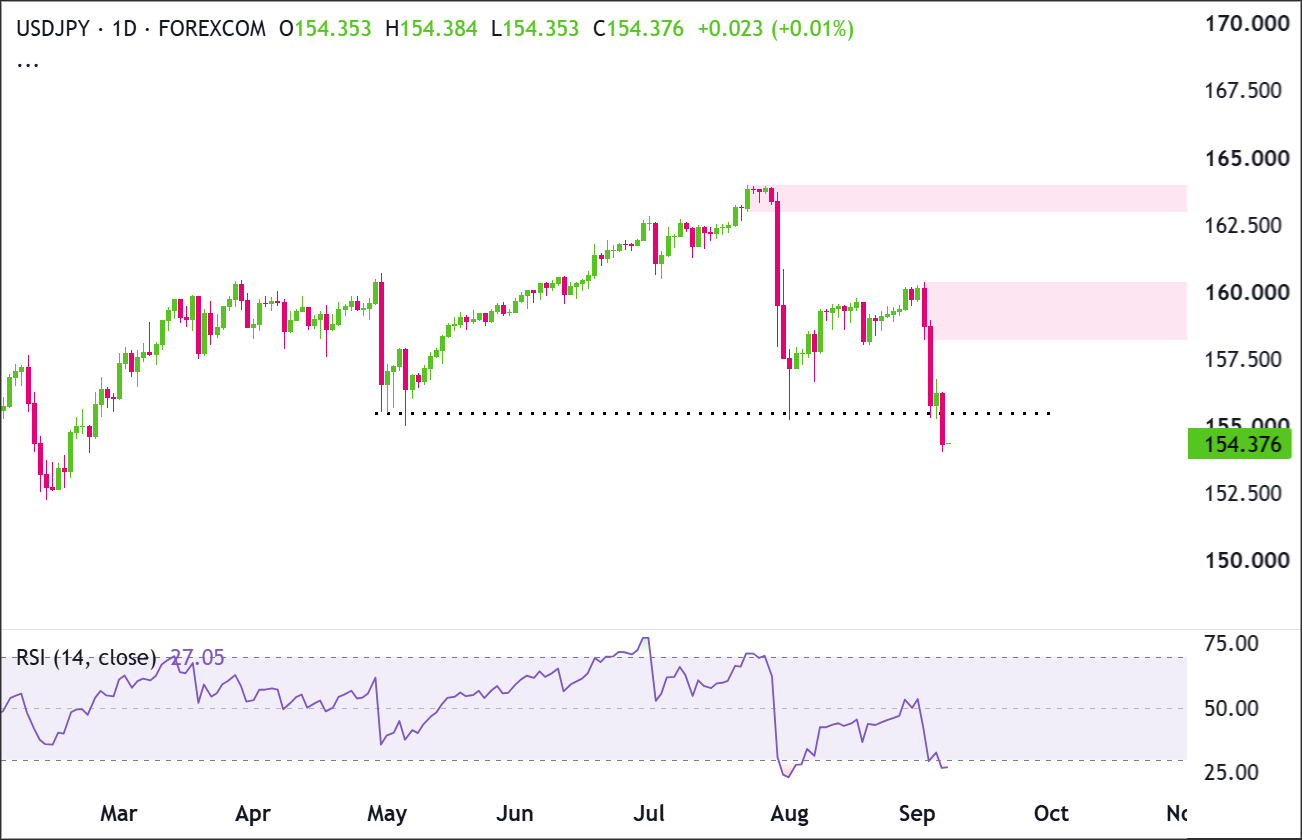
USD/JPY’s 14-day RSI dropped to 26 crossing below the 30 oversold threshold on the daily timeframe.
What This Signals
When RSI falls below 30, it usually means selling momentum has become stretched.
That can attract dip buyers or encourage traders to take profits on short positions, especially if price starts to settle near a support area.
If RSI climbs back above 30 and price begins breaking above nearby resistance, it can be an early sign that selling pressure is starting to fade.
But an oversold RSI does not automatically mean a reversal is coming.In a strong downtrend, RSI can stay oversold for several sessions while price continues to fall.
Sometimes the market will bounce briefly, only for sellers to step back in and push it lower again.
The late-July and early-August move is a good example, when RSI stayed deeply oversold even as USD/JPY continued to decline.
That is why confirmation matters. Traders will want to watch how price behaves around support, whether RSI starts to recover, and whether buyers can reclaim nearby resistance.
An oversold reading can signal that sellers are running out of steam, but it can also mean the downtrend still has plenty of momentum.
How It Works
RSI (Relative Strength Index) is a momentum indicator that compares recent gains with recent losses over a set period, in this case 14 days. I
t moves between 0 and 100, with readings below 30 typically seen as oversold and readings above 70 seen as overbought.
But an oversold reading does not mean the price is automatically cheap or ready to bounce.
It simply means selling has been stronger than buying recently. In a strong downtrend,
RSI can stay oversold for a while, which is why traders often use it alongside support and resistance levels and other signs of confirmation.
Important: RSI oversold conditions are generally more actionable when they appear into a well-defined support zone, when downside candles begin to lose range, or when RSI starts forming higher lows (a potential divergence) while price stops making lower lows.
What to Look For Before Acting
Don’t assume an oversold RSI means a rebound is coming right away. Look for signs that selling pressure is actually starting to fade:
✅ RSI moves back above 30 and stays there, showing momentum is beginning to recover.
✅ Price starts to stabilize near support, with smaller down candles, rejection wicks, or a clear base forming.
✅ Price reclaims nearby resistance, suggesting buyers are starting to regain control.
✅ Daily rebounds begin making higher highs, rather than fading after brief intraday bounces.
✅ RSI improves as price forms a base, especially if bullish divergence begins to develop.
✅ The weekly chart supports the setup, helping determine whether this is a pullback within a broader uptrend or part of a larger downtrend.
✅ Key macro drivers remain in focus, including rate expectations, central bank signals, economic data, and potential intervention risk.
Risk Considerations
⚠️ RSI can stay oversold during a strong selloff, so buying too early can be risky.
⚠️ Short-term rebounds can fade quickly if sellers remain in control, which can lead to whipsaw price action.
⚠️ A clear break below recent support could open the door to another leg lower.
⚠️ USD/JPY can move sharply on shifts in Bank of Japan expectations, rate outlooks, economic data, and policy headlines, sometimes overwhelming technical signals.
⚠️ Intervention risk is another factor to watch, as comments or action from Japanese authorities can trigger sudden and sharp moves in the yen.
Potential Next Steps
Add USD/JPY to a watchlist and watch how price behaves around the recently broken 155.50 level.
Sellers have taken control in the short term, but RSI is now oversold, so a bounce would not be surprising.
The next move should help show whether this breakdown has more room to run or whether buyers are ready to step back in.
Technical Analysis
The latest rally ran into trouble inside 158.20–160.30, where sellers stepped back in and pushed price sharply lower.
Price has also broken below 155.50, a level that matters because buyers had defended this level on two previous occasions.
RSI has dropped to around 27 and moved into oversold territory. This shows strong selling pressure, but it also means the move is becoming stretched and could be vulnerable to a short-term rebound.
As long as price stays below 155.50, sellers have the advantage.
Buyers would need to reclaim 155.50 first and then work their way back above 158.20–160.30 before the recent weakness starts to look like a failed breakdown.
Trade Idea: Bullish Continuation Scenario
Setup
The bullish setup would come into play if the break below 155.50 turns out to be temporary.
With RSI already oversold, price could bounce if buyers return and quickly push USD/JPY back above this level.
A stronger bullish signal would come if price can eventually break through the 158.20–160.30 supply zone. This would show that buyers have done more than simply create a short-term rebound.
Entry
Consider entering long on a daily close above 160.30, confirming that buyers are breaking out of the recent structure.
Alternatively, enter on a controlled pullback into 155.50–156.00 if price first reclaims this area, settles there, and starts moving higher again.
If price falls back below this support area and closes decisively below 154.00, stand aside and wait for either deeper support to form or a cleaner breakout later.
Stop Loss
For breakout entries: stop on a daily close back below 158.20. This would invalidate the breakout by showing price could not stay above the former resistance area.
For pullback entries: stop on a daily close below 154.00. This would invalidate the support-hold idea and show buyers are no longer defending the area.
Take Profit
Target 162.90–164.00, because this is the next clear supply area above price and a logical place for sellers to step back in if the recovery continues.
Bottom Line
The bullish case starts to improve if USD/JPY can reclaim 155.50. From there, a break above 160.30 would be the stronger confirmation that buyers are taking back control.
If this happens, 162.90–164.00 becomes the next upside area to watch. A daily close below 154.00 would invalidate the bullish recovery idea.
Trade Idea: Bearish Pullback Scenario
Setup
The bearish setup is more in line with the current price action. USD/JPY was rejected from 158.20–160.30 and has now broken through 155.50, even though buyers had successfully defended this level twice before.
As long as price remains below 155.50, sellers have room to keep pressing lower.
The 152.50–153.00 area could slow the decline, but if this support gives way, 150.00 becomes a reasonable next target.
Entry
Consider entering short on a daily close below 154.00, confirming that the breakdown is continuing.
Alternatively, if price bounces back into 155.50–156.00 and then prints a clear bearish rejection candle, enter short on the next daily close back below 155.50.
If price instead rallies and closes decisively above 160.30, stand aside, as this would invalidate the bearish pullback idea.
Stop Loss
For breakdown entries: stop on a daily close back above 155.50. This would invalidate the breakdown by showing price has reclaimed the level it just lost.
For rejection entries near resistance: stop on a daily close above 160.30. This would invalidate the bearish idea by showing buyers have pushed through the recent supply zone.
If price starts moving lower in your favor, consider trailing the stop above newly formed lower highs. This gives the trade room to develop while also protecting more of the position if price suddenly turns higher.
Take Profit
Target 150.00, which is a major round-number psychological level and a natural downside objective if sellers stay in control.
Price could still react around 152.50–153.00 first. Instead of automatically closing the trade there, consider trailing the stop and giving USD/JPY a chance to continue toward 150.00 if the downtrend remains intact.
Bottom Line
The bearish case stays in place while USD/JPY remains below 155.50.
A daily close below 154.00 would add more confirmation that sellers are still in control, with 152.50–153.00 the first area that could slow the move.
If price keeps making lower highs and lower lows, consider trailing the stop and letting the trade run toward 150.00. A strong recovery above 160.30 would invalidate the bearish setup.
This content is strictly for informational purposes only and does not constitute as investment advice. Trading any financial market involves risk. Please read our Risk Disclosure to make sure you understand the risks involved.



